Whether It Breaks Or Reverts To This Years Trend 85 Is Key For NZDCAD
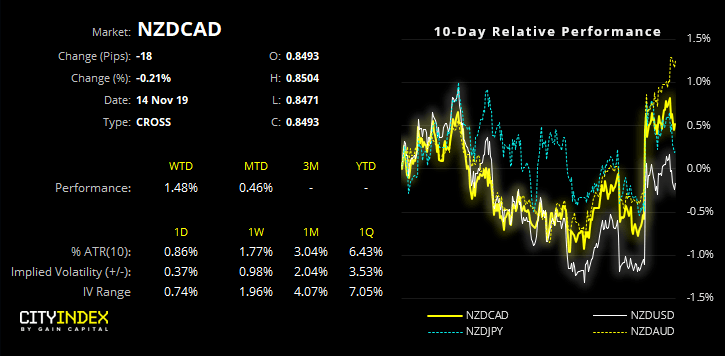
Just as NZD/CAD tests a key level of resistance, it’s worth considering its potential for a change of trend. Personally, I think the bearish trend on NZD/CAD has been one of the better ones for FX traders this year. Since failing to break a key resistance level in March, the commodity FX cross tumbled over 11% (or over 1000 pips) within a relatively clean downtrend.
Yet having tested the upper bounds of it bearish channel on the daily chart, NZD/CAD has approached an inflection point and there are compelling arguments for both bulls and bears to consider.
Bearish swing traders could take comfort in the following:
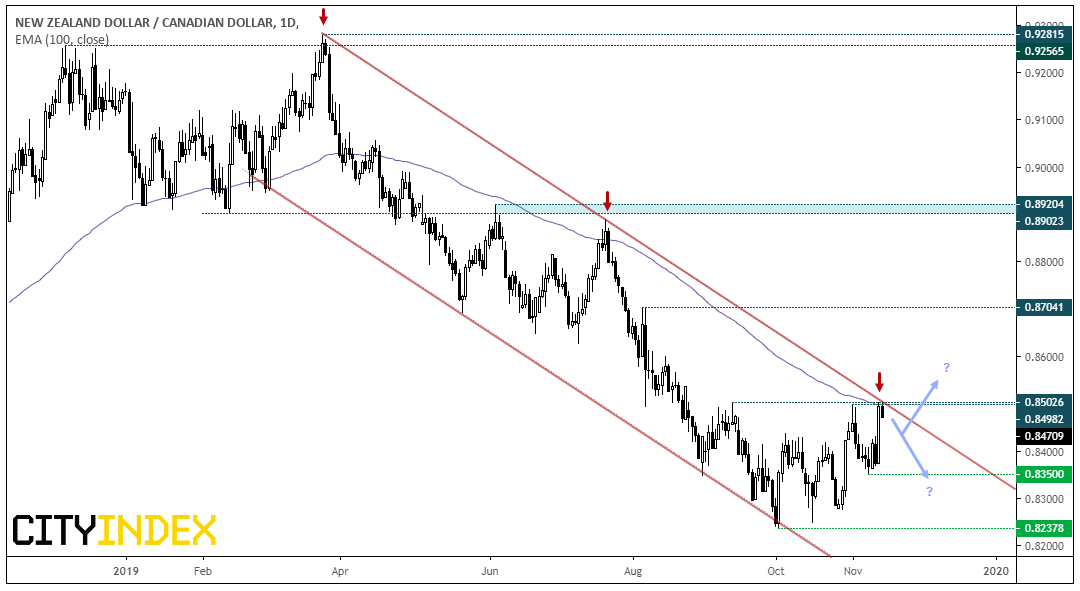
- Price action remains within the bearish channel projected from the March peak, and the 100-day eMA is also capping as resistance.
- Timing wise, yesterday’s high is eerily similar distance from its prior leak; the first spanned 85 days and yesterday’s spanned 82 days.
- Whilst prices have recovered nearly 3% from this year’s low, the overlapping nature if price swings suggest the rebound is corrective, so poised to turn lower once more.
- BoC have rates at a ‘whopping’ 1.75% compared with RBNZ’s 1.0%, which provides Canada a positive yield differential with New Zealand.
Contrarians (bulls in this instance) could take note of the following:
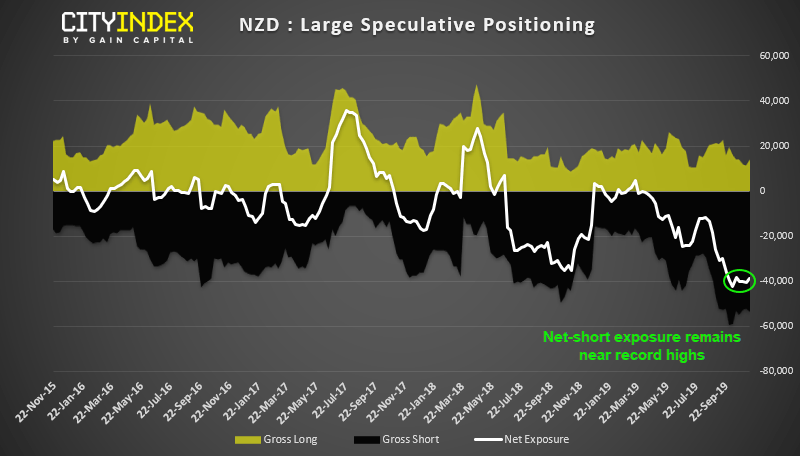
- Net-short exposure on NZD futures remains near a historical extreme. The 3-year Z-score is around -3.5 standard deviations and the 1-year was recently below -2 SD, level which have been associated with a short squeeze historically. Ultimately, NZD could be vulnerable to short covering (as seen yesterday) if data improves and / or RBNZ are less dovish.
- Whilst differentials currently favour CAD, markets will respond if they suspect this differential will narrow which would be positive for NZD/CAD. And as it’s possible RBNZ will hold at 1% so, if CAD data weakens, then it could well send NZD/CAD higher.
- The CA2-NZ2 year differential is on the cusp of braking its bearish trendline.
- Yes, prices have stalled near a cluster of resistance. Yet if these levels are to be broken it could trigger stops and exacerbate a bullish follow through.
Given the importance of 0.8500 resistance, NZD/CAD could well turn lower over the near-term. Yet due to the strength of momentum leading into resistance, an eventual upside break is the bias whilst prices hold above the 0.8347/63 lows. Also take note of the rounding bottom forming which, if successful, projects an approximate target around 0.8770.
- Bears could look to fade into moves below the trendline and / or 0.8500 resistance
- Bulls could wait for a break above 0.8500 to confirm the rounding bottom and target the 0.8700 highs (although target projects 0.8770)
- Alternatively, for those who like to scale in, bulls could look for dips above the 0.83470/36 lows in anticipation of a breakout
Related analysis:
The Aussie Tanks on Weak Employment Report | AUD/USD
RBNZ Hold Rate And Refrain From A Dovish Meeting – Is the Low in? | AUD/NZD
RBA Discussed Keeping Cuts For A Rainy Day | AUD/EUR, AUD/NZD
AUD Firmer On Lower Unemployment | AUD/JPY, AUD/NZD, EUR/AUD
From time to time, StoneX Financial Pty Ltd (“we”, “our”) website may contain links to other sites and/or resources provided by third parties. These links and/or resources are provided for your information only and we have no control over the contents of those materials, and in no way endorse their content. Any analysis, opinion, commentary or research-based material on our website is for information and educational purposes only and is not, in any circumstances, intended to be an offer, recommendation or solicitation to buy or sell. You should always seek independent advice as to your suitability to speculate in any related markets and your ability to assume the associated risks, if you are at all unsure. No representation or warranty is made, express or implied, that the materials on our website are complete or accurate. We are not under any obligation to update any such material.
As such, we (and/or our associated companies) will not be responsible or liable for any loss or damage incurred by you or any third party arising out of, or in connection with, any use of the information on our website (other than with regards to any duty or liability that we are unable to limit or exclude by law or under the applicable regulatory system) and any such liability is hereby expressly disclaimed.
City Index is a trading name of StoneX Financial Pty Ltd.
The material provided herein is general in nature and does not take into account your objectives, financial situation or needs.
While every care has been taken in preparing this material, we do not provide any representation or warranty (express or implied) with respect to its completeness or accuracy. This is not an invitation or an offer to invest nor is it a recommendation to buy or sell investments.
StoneX recommends you to seek independent financial and legal advice before making any financial investment decision. Trading CFDs and FX on margin carries a higher level of risk, and may not be suitable for all investors. The possibility exists that you could lose more than your initial investment further CFD investors do not own or have any rights to the underlying assets.
It is important you consider our Financial Services Guide and Product Disclosure Statement (PDS) available at www.cityindex.com/en-au/terms-and-policies/, before deciding to acquire or hold our products. As a part of our market risk management, we may take the opposite side of your trade. Our Target Market Determination (TMD) is also available at www.cityindex.com/en-au/terms-and-policies/.
StoneX Financial Pty Ltd, Suite 28.01, 264 George Street, Sydney, NSW 2000 (ACN 141 774 727, AFSL 345646) is the CFD issuer and our products are traded off exchange.
© City Index 2024