Weekly Technical Outlook on Major Stock Indices Residual push up to complete medium term top
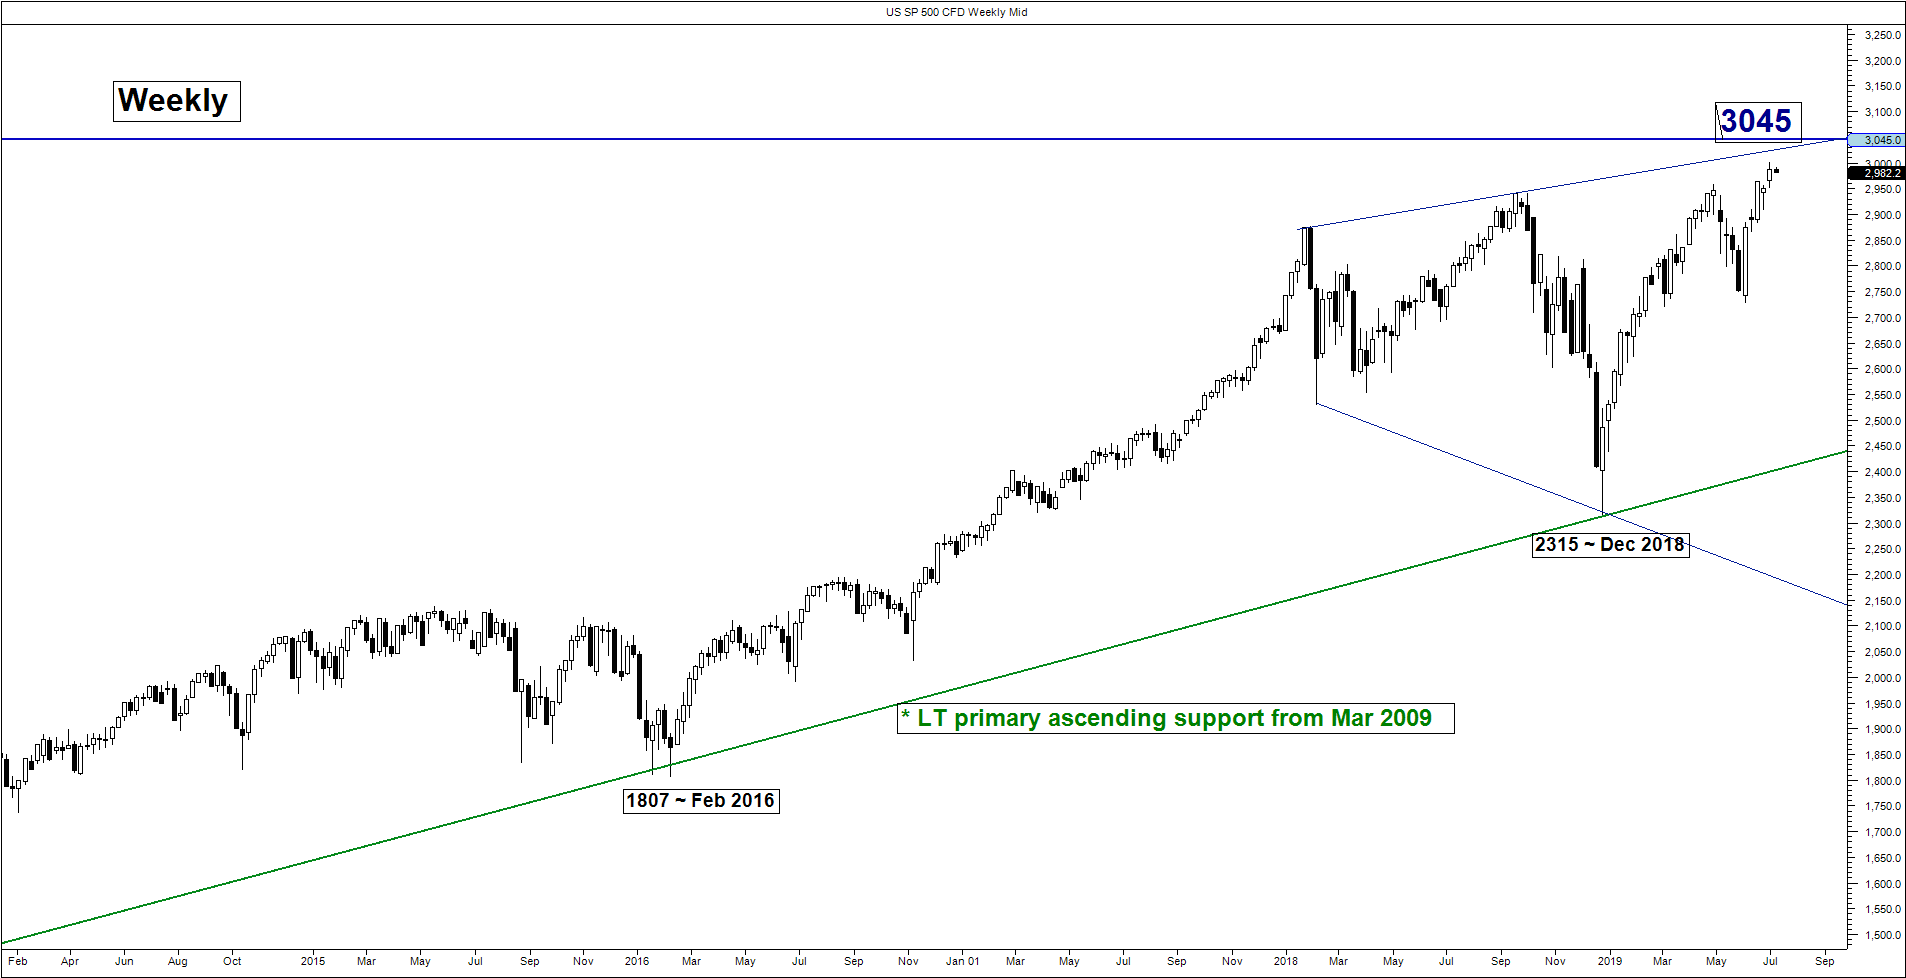
S&P 500 – Coming close to a potential medium-term top
click to enlarge charts
Key Levels (1 to 3 weeks)
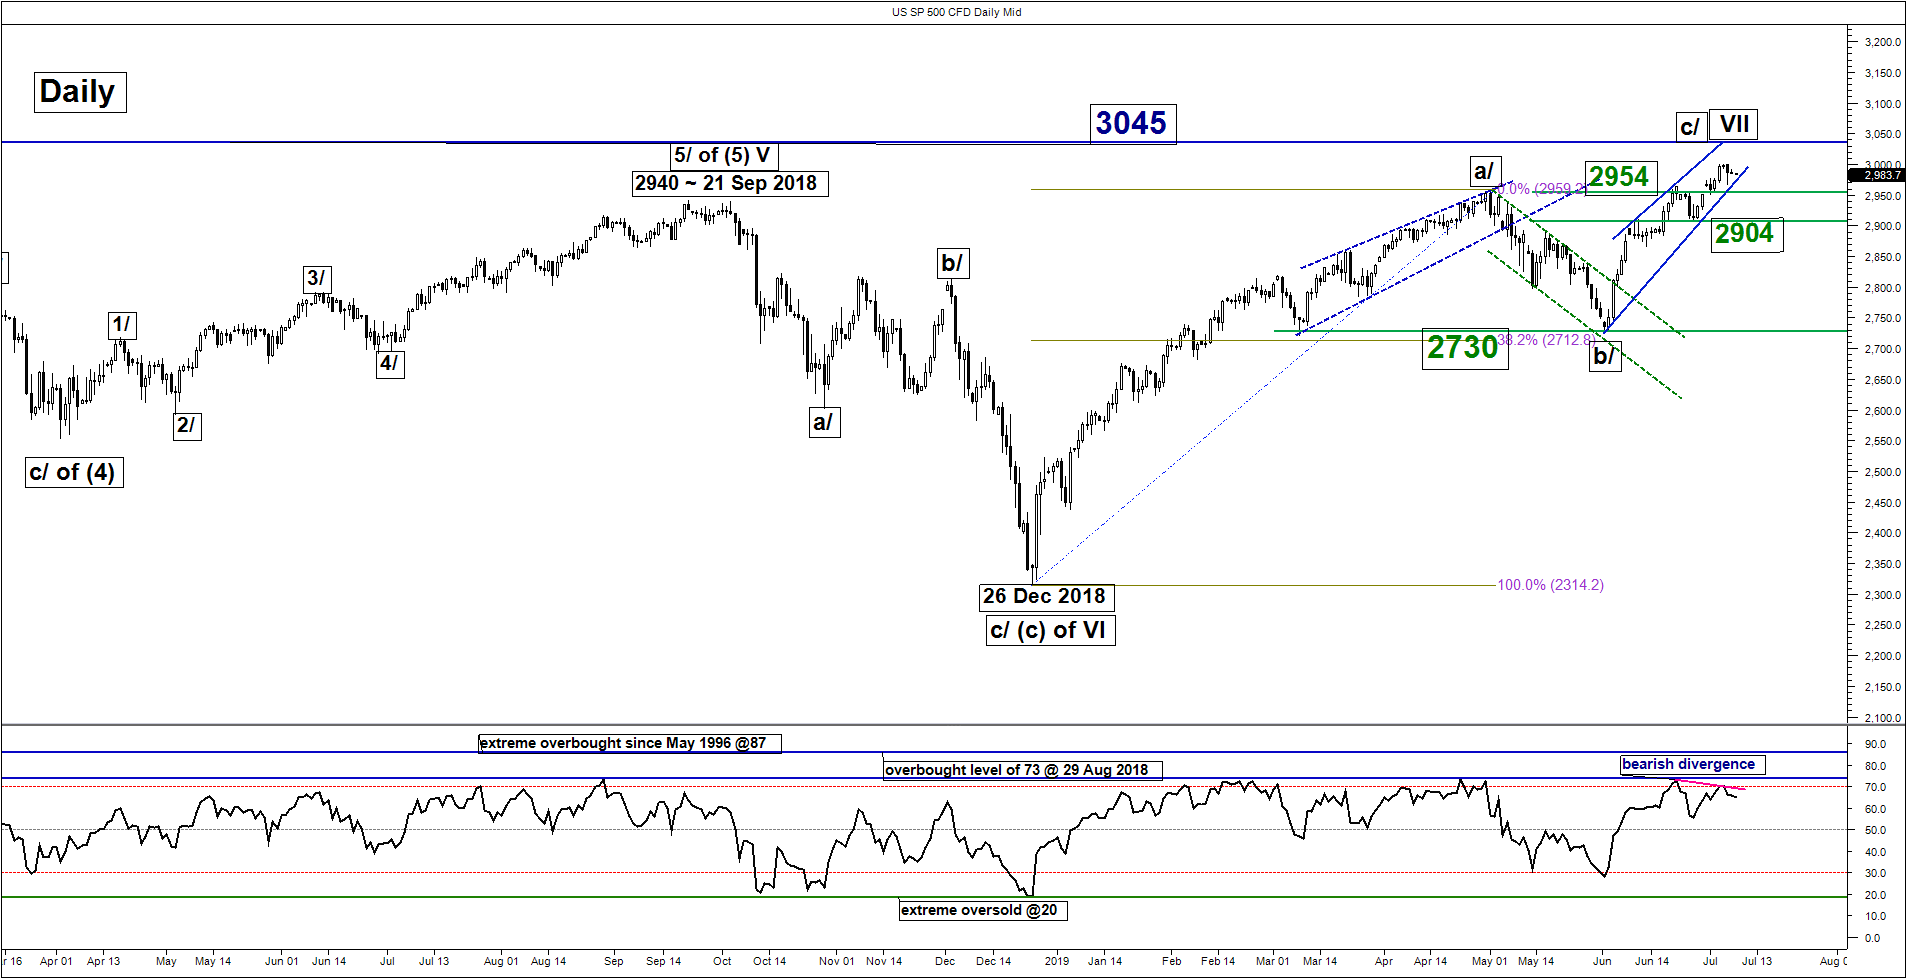
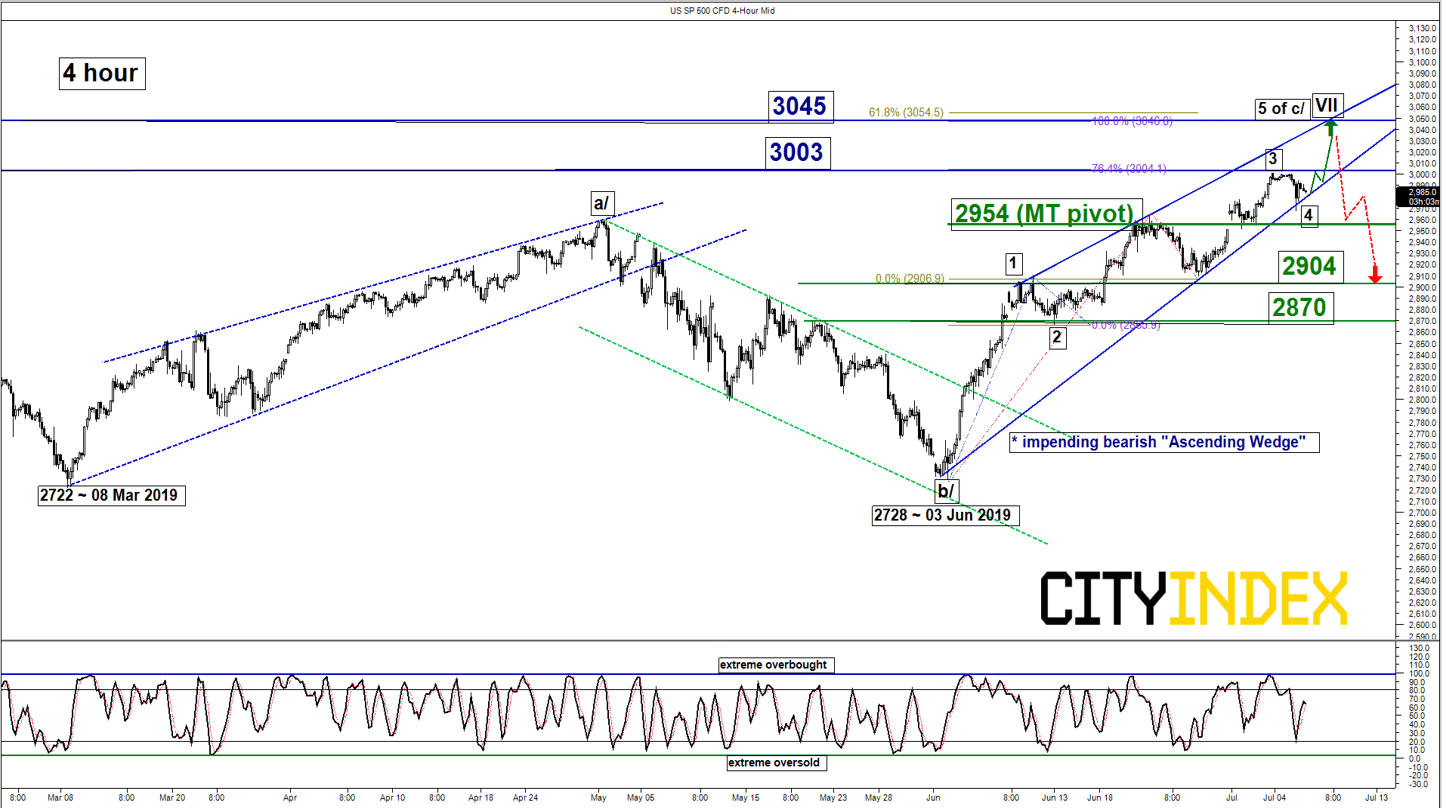
Intermediate support: 2967
Pivot (key support): 2954
Resistances: 3003 & 3045 (Fibonacci expansions)
Next supports: 2904 & 2870
Medium-term (1 to 3 weeks) Outlook
Last week, the SP 500 Index (proxy for the S&P 500 futures) has continued to surge upwards to print another fresh all-time high level of 3000 on 04 Jul, Asian session which is closed to our first upside target/resistance of 3003 as per highlighted in our previous weekly outlook report (click here for a recap).
Bulls now got to be cautious in the medium-term as the price action of the Index has completed two-third of the bearish “Ascending Wedge” in place since 03 Jun 2019 low of 2728 with a bearish divergence signal seen in the daily RSI oscillator at its overbought region.
These observations suggest that upside momentum has started to ease. Elliot Wave/fractal analysis suggests that the Index may see a residual push up before a multi-week corrective down move materialises (approximately 8% to 10%).
Therefore, we maintain the bullish bias with a tightened key medium-term pivotal support at 2954 for a potential residual push up to target 3003 and 2954. However, a daily close below 2954 invalidates the residual push scenario to kick start the corrective down move sequence towards the next supports at 2904 and 2870 in the first step.
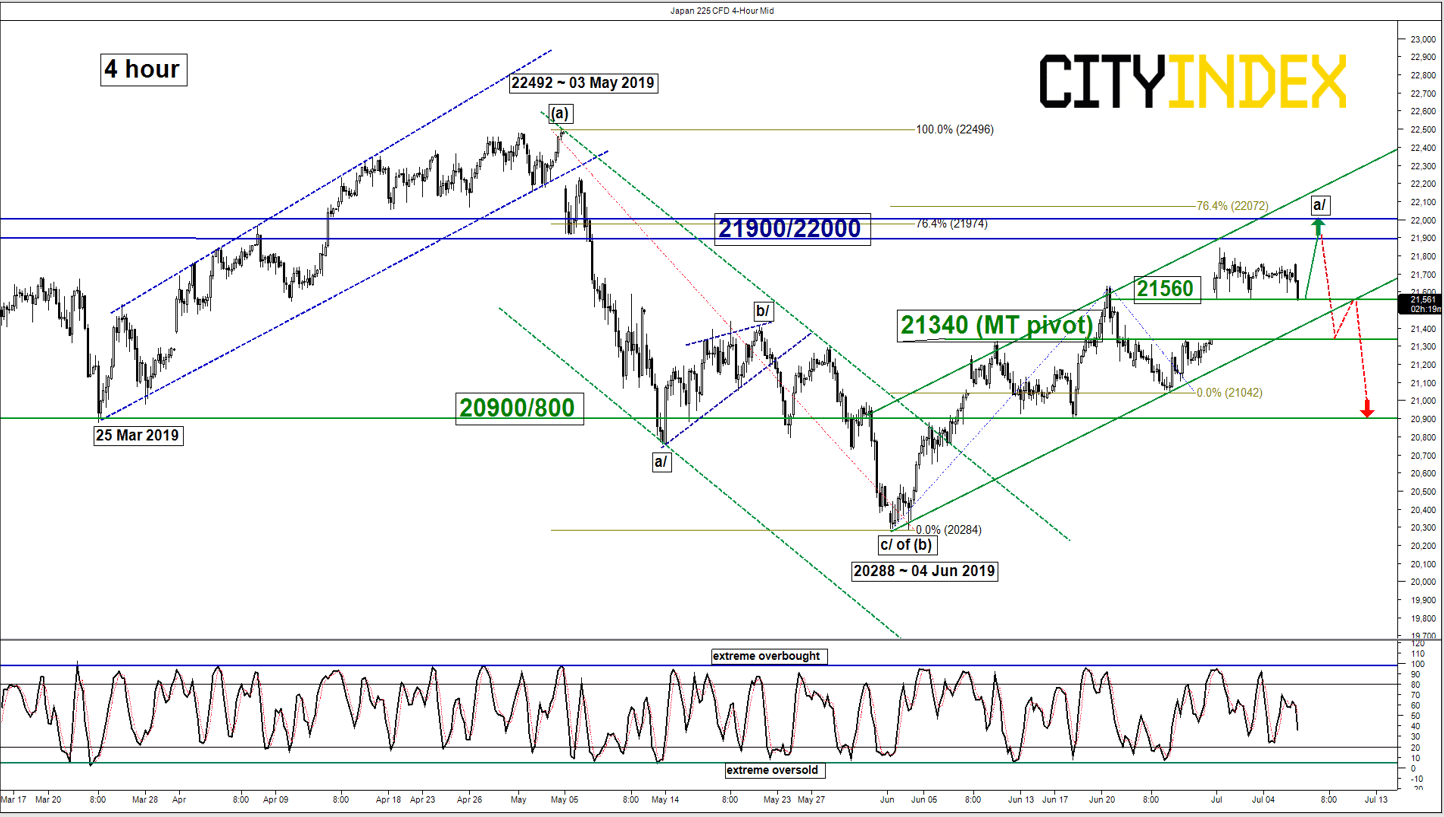
Nikkei 225 – 21340 is the key support to watch to maintain residual push up
click to enlarge charts
Key Levels (1 to 3 weeks)
Intermediate support: 21560
Pivot (key support): 21340
Resistance: 21900/22000
Next support: 20900/800
Medium-term (1 to 3 weeks) Outlook
After the recent post G20 summit gapped up of 2.3% seen on last Mon 01 Jul, the Japan 225 Index (proxy for the Nikkei 225 futures) has traded sideways for the rest of last week.
Maintain bullish bias with a tightened key short-term pivotal support now at 21340 for a potential residual push up to target the 21900/22000 resistance zone.
However, a daily close below 21340 invalidates the residual push up scenario to kick start the multi-week corrective down move sequence towards the next support at 20900/800 in the first step.
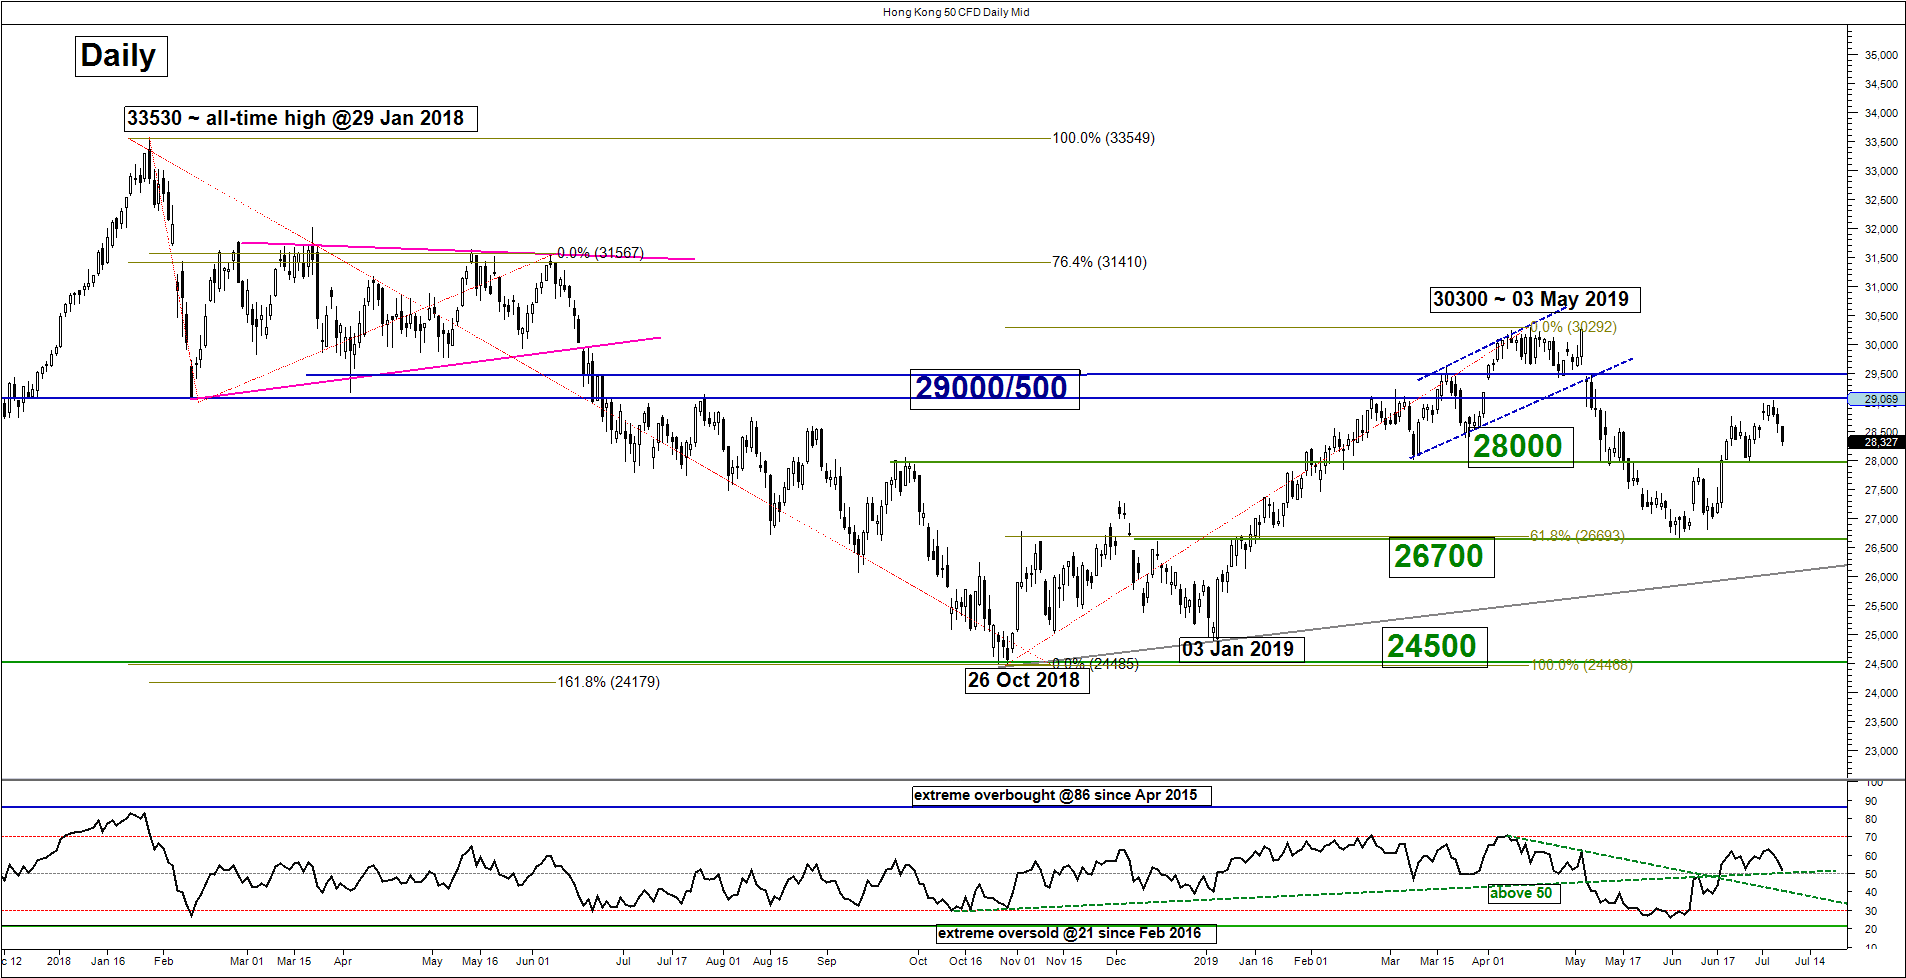
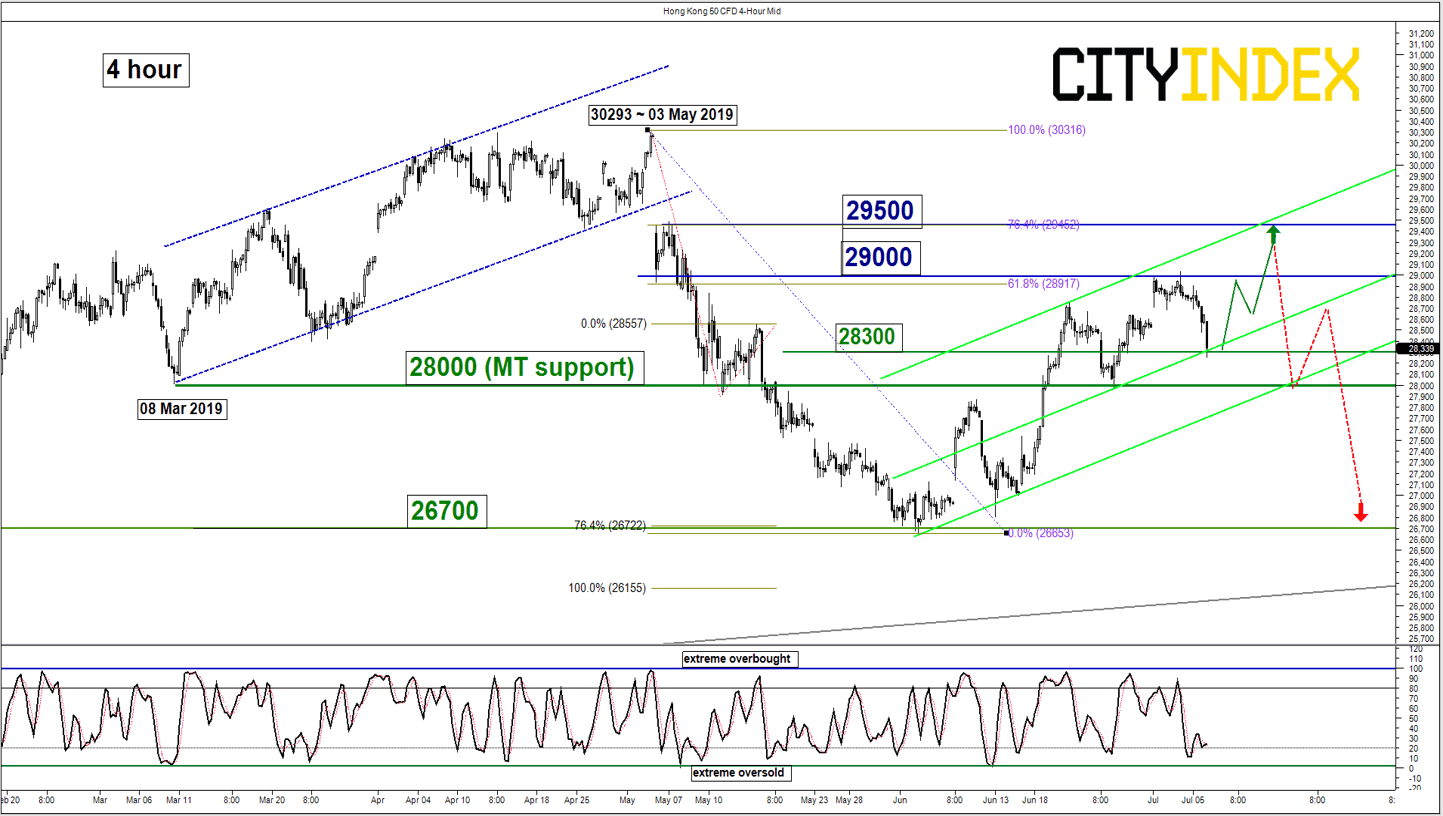
Hang Seng – Residual push up towards 29500
click to enlarge charts
Key Levels (1 to 3 weeks)
Intermediate support: 28300
Pivot (key support): 28000
Resistances: 29000 & 29500
Next support: 26700
Medium-term (1 to 3 weeks) Outlook
Last week, the Hong Kong 50 Index (proxy for Hang Seng Index futures) has staged the expected push up and met the first upside target/resistance of 29000 (printed a high of 29029 on 04 Jul).
Thereafter, it has pull-backed by -2.6% to test the intermediate support of 28300 post U.S job data release on last Fri, 05 Jul where non-farm payrolls came in better than expected that has reduced the expectation of a 50 bps cut on the Fed funds rate on the upcoming FOMC meeting on 31 Jul.
Maintain bullish bias with 28000 as the key medium-term pivotal support for a potential residual push up to target 29500 next. However, a daily close below 28000 invalidates the bullish scenario to kick start the multi-week corrective decline towards the next support at 26700 in the first step.
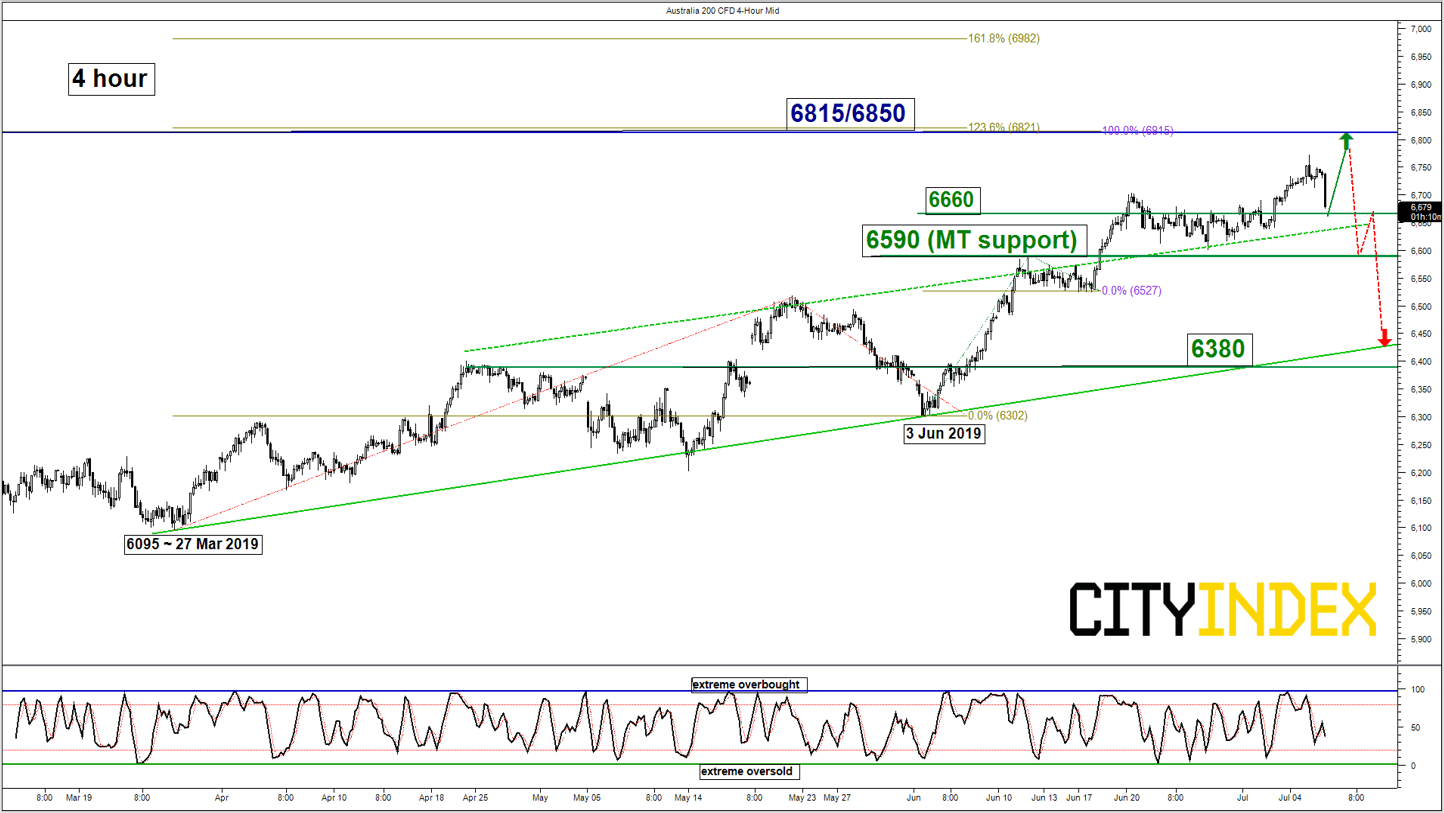
ASX 200 – Residual push up above 6590 key support
click to enlarge charts
Key Levels (1 to 3 weeks)
Intermediate support: 6660
Pivot (key support): 6590
Resistance: 6815/6850
Next support: 6380
Medium-term (1 to 3 weeks) Outlook
Last week, the Australia 200 Index (proxy for the ASX 200 futures) has staged the expected bullish breakout above 6703 to print a high of 6772 on last Fri, 05 Jul.
Right now, it is undergoing a pull-back of -1.4% above its key support zone. We maintain the bullish bias with a tightened key medium-term pivotal support now at 6590 for a potential residual push up to target the next resistance zone at 6815/50 (all-time high & Fibonacci expansion cluster).
However, a daily close below 6590 invalidates the bullish scenario to kick start the multi-week corrective down move sequence towards the next support at 6380.
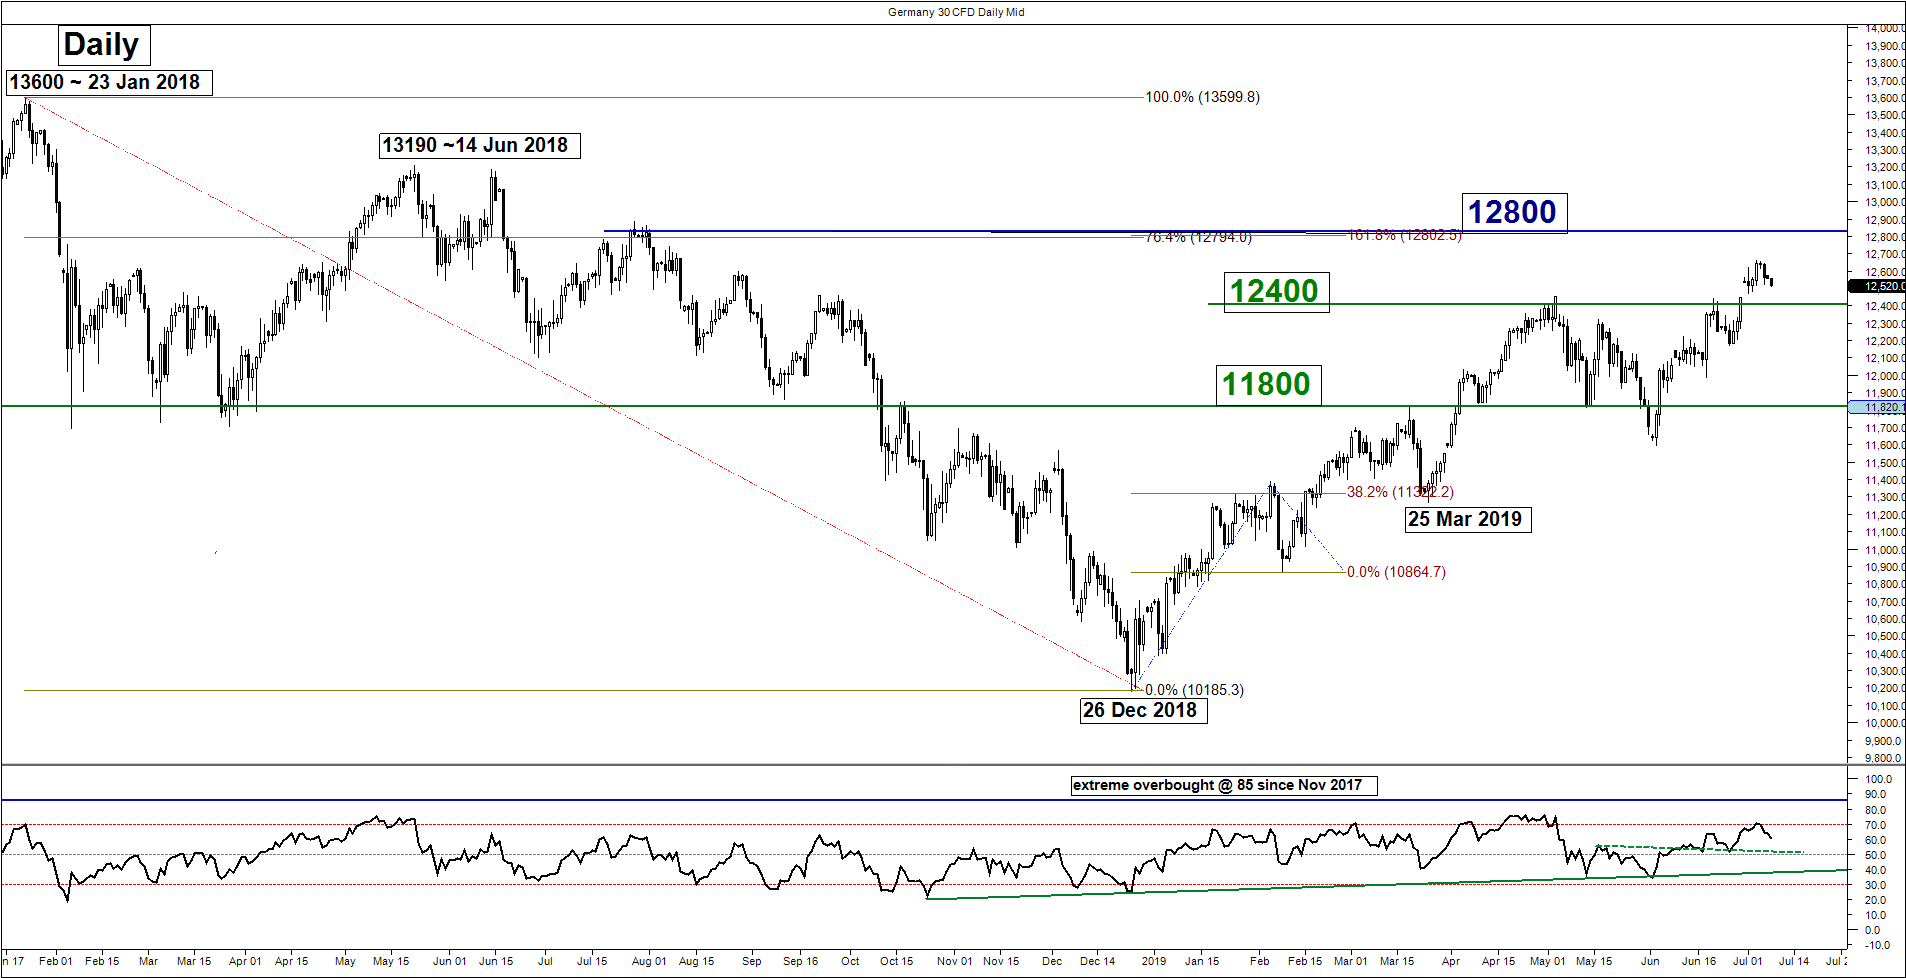
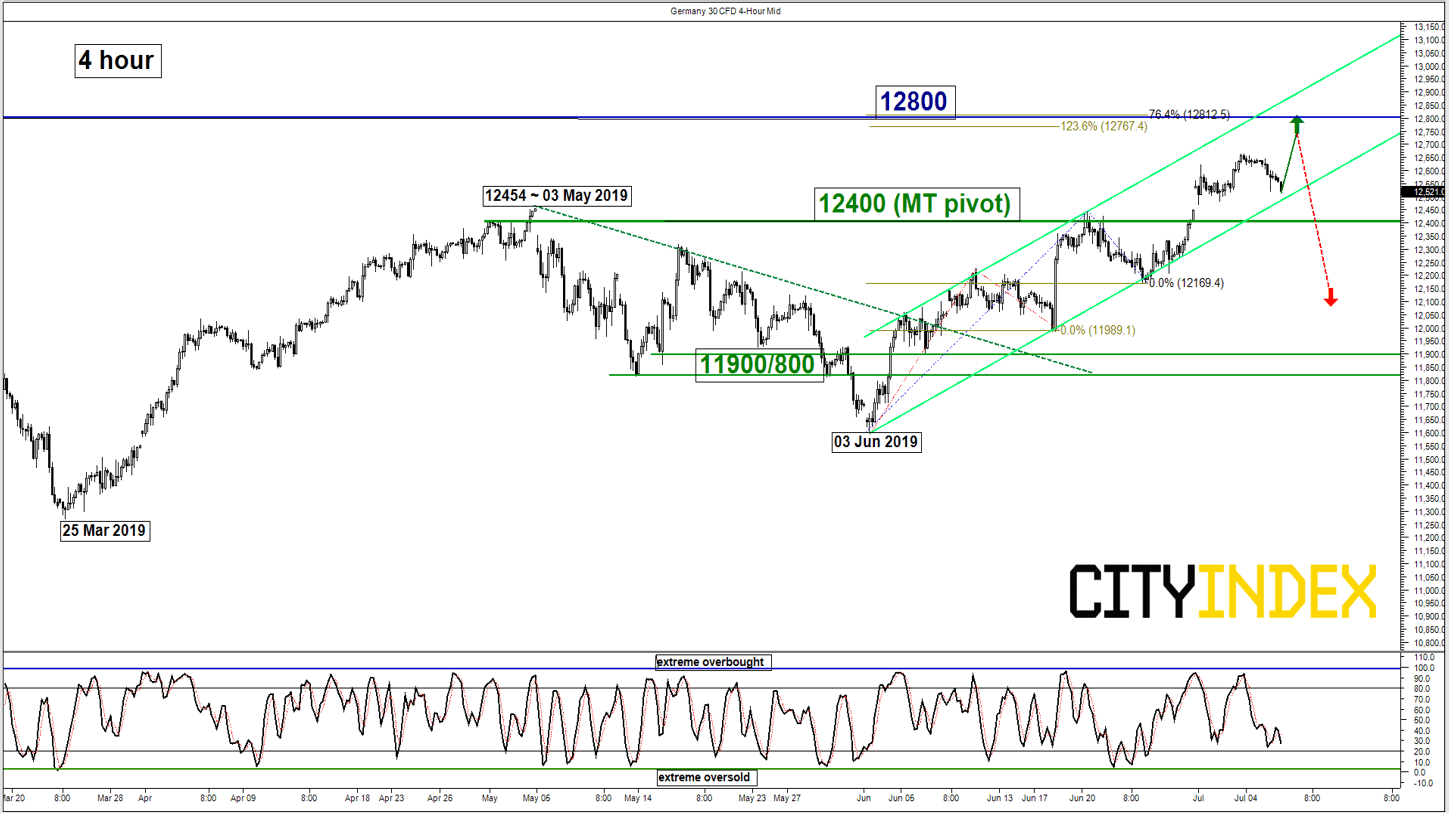
DAX – Residual push up above 12400 key support
click to enlarge charts
Key Levels (1 to 3 weeks)
Pivot (key support): 12400
Resistance: 12800 (Fibonacci expansion/retracement cluster)
Next support: 11900/800
Medium-term (1 to 3 weeks) Outlook
Last week, the Germany 30 Index (proxy for the DAX futures) has shaped the expected push up to print a high of 12663 on last Wed, 03 Jul U.S. session.
Maintain bullish bias with a tightened key medium-term pivotal support now at 12400 for a potential residual push up to target the 12800 resistance before a corrective down move materialises.
However, a daily close below 12400 invalidates the bullish scenario to kick start the multi-week corrective down move sequence to retest the major support zone of 11900/800.
Charts are from City Index Advantage TraderPro
From time to time, StoneX Financial Pty Ltd (“we”, “our”) website may contain links to other sites and/or resources provided by third parties. These links and/or resources are provided for your information only and we have no control over the contents of those materials, and in no way endorse their content. Any analysis, opinion, commentary or research-based material on our website is for information and educational purposes only and is not, in any circumstances, intended to be an offer, recommendation or solicitation to buy or sell. You should always seek independent advice as to your suitability to speculate in any related markets and your ability to assume the associated risks, if you are at all unsure. No representation or warranty is made, express or implied, that the materials on our website are complete or accurate. We are not under any obligation to update any such material.
As such, we (and/or our associated companies) will not be responsible or liable for any loss or damage incurred by you or any third party arising out of, or in connection with, any use of the information on our website (other than with regards to any duty or liability that we are unable to limit or exclude by law or under the applicable regulatory system) and any such liability is hereby expressly disclaimed.
City Index is a trading name of StoneX Financial Pty Ltd.
The material provided herein is general in nature and does not take into account your objectives, financial situation or needs.
While every care has been taken in preparing this material, we do not provide any representation or warranty (express or implied) with respect to its completeness or accuracy. This is not an invitation or an offer to invest nor is it a recommendation to buy or sell investments.
StoneX recommends you to seek independent financial and legal advice before making any financial investment decision. Trading CFDs and FX on margin carries a higher level of risk, and may not be suitable for all investors. The possibility exists that you could lose more than your initial investment further CFD investors do not own or have any rights to the underlying assets.
It is important you consider our Financial Services Guide and Product Disclosure Statement (PDS) available at www.cityindex.com/en-au/terms-and-policies/, before deciding to acquire or hold our products. As a part of our market risk management, we may take the opposite side of your trade. Our Target Market Determination (TMD) is also available at www.cityindex.com/en-au/terms-and-policies/.
StoneX Financial Pty Ltd, Suite 28.01, 264 George Street, Sydney, NSW 2000 (ACN 141 774 727, AFSL 345646) is the CFD issuer and our products are traded off exchange.
© City Index 2024