Weekly COT Report Guide
Weekly COT Report Guide
CFTC (US Commodity Futures Trading Commission) provide a weekly report on market positioning among groups of traders called the Commitments of Traders (COT) Report. As the original report is in numerical format, we take this data and represent it visually help traders assess market sentiment, trend strength or highlight potential sentiment extremes.
- Whilst the original report covers a broad range of futures markets, our weekly COT report tends to focus on major currencies* and select commodities. However, if we note something of interest elsewhere, the report can venture over to other metals, indices, interest rates or the VIX.
- The trading group we mostly focus on are ‘large speculators’ and, on occasion, managed funds. We can look at large speculators as trend followers and, using by the assumption that large speculators tend to be on the right side of the market as they are professional traders, assess which way ‘smart money’ is positioned on a given market. Taking that a step further, if too many traders are on the same side of the market, it raises the potential for a entiment extreme if positioning is stretched or at a historical extreme(a reversal of prices).
- As the data is released weekly, it is not of great use to intraday traders. However, it can help us assess the underlying strength or weakness of a trend on the weekly charts.
* As the COT report focuses futures markets, currencies are traded against the USD. This means the currency on the matrix is the numerator, and the USD is the denominator (e.g. CAD = CAD/USD, JPY = JPY/USD, GBP = GBP/USD)
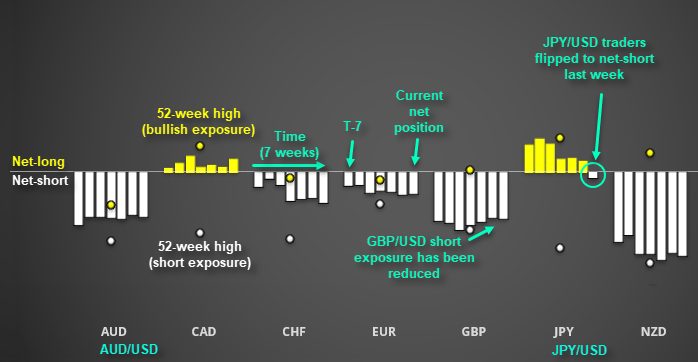
COT Dashboard Overview:
The COT dashboards provides several pieces of useful information at a glance:
- Net exposure of large- speculators* (whether they are net-long or net-short)
- The recent trend/direction of net- exposure (is the trend stronger, weaker or flat?)
- Where net-long or net-short exposure sits relative to its 52-week high**
- If a market has ‘flipped’ from net-long to net-short (or visa-versa)
* Please note that net-short exposure has been inverted to produce a negative number. This allows us easily gauge whether traders are net-long or net-short and compare to what degree they are bullish or bearish between markets.
** Net exposure for each market has been adjusted for open interest (volume). This essentially rescales the markets for easier comparison, even if some markets have very high trading volumes (e.g. EUR/USD) or very low volumes (e.g. NZD/USD).
COT Charts: Individual Markets
Like a trading chart, time goes from left to right with the most recent data sitting at the far right end of the chart. Usually the chart will also include the weekly closing prices of the underlying market (so a CAD COT chart would also include CAD/USD as an overlay). But for the sake of simplicity, the above example focuses on market positioning.
- White line: Net exposure (net-long/bullish above zero, net-short/bearish below zero)
- Yellow: Gross long contracts (total number of long contracts)
- Black: Gross short contracts (total number of short contracts)
Readers are free to make your own interpretations of that data. However, our weekly COT report also includes the analyst’s interpretation of the data below each chart. Furthermore, we’ll occasionally include variations of the COT chart such as Z-score or long/short ratio if we feel it underscores the analysis, which will be explained in the report where relevant.
From time to time, StoneX Financial Pty Ltd (“we”, “our”) website may contain links to other sites and/or resources provided by third parties. These links and/or resources are provided for your information only and we have no control over the contents of those materials, and in no way endorse their content. Any analysis, opinion, commentary or research-based material on our website is for information and educational purposes only and is not, in any circumstances, intended to be an offer, recommendation or solicitation to buy or sell. You should always seek independent advice as to your suitability to speculate in any related markets and your ability to assume the associated risks, if you are at all unsure. No representation or warranty is made, express or implied, that the materials on our website are complete or accurate. We are not under any obligation to update any such material.
As such, we (and/or our associated companies) will not be responsible or liable for any loss or damage incurred by you or any third party arising out of, or in connection with, any use of the information on our website (other than with regards to any duty or liability that we are unable to limit or exclude by law or under the applicable regulatory system) and any such liability is hereby expressly disclaimed.
City Index is a trading name of StoneX Financial Pty Ltd.
The material provided herein is general in nature and does not take into account your objectives, financial situation or needs.
While every care has been taken in preparing this material, we do not provide any representation or warranty (express or implied) with respect to its completeness or accuracy. This is not an invitation or an offer to invest nor is it a recommendation to buy or sell investments.
StoneX recommends you to seek independent financial and legal advice before making any financial investment decision. Trading CFDs and FX on margin carries a higher level of risk, and may not be suitable for all investors. The possibility exists that you could lose more than your initial investment further CFD investors do not own or have any rights to the underlying assets.
It is important you consider our Financial Services Guide and Product Disclosure Statement (PDS) available at www.cityindex.com/en-au/terms-and-policies/, before deciding to acquire or hold our products. As a part of our market risk management, we may take the opposite side of your trade. Our Target Market Determination (TMD) is also available at www.cityindex.com/en-au/terms-and-policies/.
StoneX Financial Pty Ltd, Suite 28.01, 264 George Street, Sydney, NSW 2000 (ACN 141 774 727, AFSL 345646) is the CFD issuer and our products are traded off exchange.
© City Index 2024