Watch Netflix spending as subscribers slow
Netflix says subscribers will fall 8% in Q2, just as it faces rising competition and higher content costs
Understandably, investors are restive ahead of Netflix’s second quarter results, scheduled for tonight at 21.00 BST. That’s one reason why the shares have dithered since marching 67% higher from late December lows to the year’s high in May. The second quarter is typically a slower one anyway, but a lighter schedule of new shows and no big-ticket releases is likely to combine with continuing impact from January’s 13%-18% price hikes to keep subscriber growth contained.
Key expectations for Netflix’s Q2 results
- Netflix forecasts International subscriber additions will rise 3% on the year to 4.7 million
- It forecasts U.S. subscriber growth will slump to $300,000, leaving total net subscriber additions down 8% to 5 million
- Adjusted EPS is expected to fall about 22% on the year to $0.77, according to an average forecast compiled by Bloomberg
- Adjusted revenue growth will look better, according to consensus, with a 26% rise to $4.93bn
- Average revenue per user should also improve given price rises. But the operating margin is expected to be subdued till the second half of the year, when the release schedule ramps up again
Spending stream
There are also concerns about Netflix’s longer-term outlook, underlined by the arrival of Disney+, at just $6.99 a month. The rival expects to have 60-90 million subscribers by 2024. Netflix’s breadth of content and dominant subscriber base—149 million and rising—should help keep new entrants at bay for years. But the group will need to sustain its long-term pace of about 20-25 million net additions a year to remain the world’s top streaming entertainment provider. To keep that position, Netflix may need to increase an already humongous spending programme to head off competitors before they can scale up. The group hasn’t clearly stated any intention to ratchet expenditure even higher. But the possibility is another nervy theme for investors. So they’re keeping a sharp eye on guidance for coming quarters, where the impact of such plans may show up first. For the year, Netflix has flagged $15bn of cash content costs. This will leave the group with a 2019 loss of around $3.5bn. Content costs could then peak at $18bn in 2020, with positive cash flow generation expected to begin from 2020 onwards—unless there’s a change of plan.
What else to watch
- Operating margin: Netflix targets 13% for the year, up from 10% and 7% in 2018 and 2017 respectively. Investors would like to see 2019’s target reiterated
- Gross margin: this should improve to a fall of just 0.6% in Q3 after a 5.5% contraction in Q2. Wall Street forecasts a 13.85% rise in Q4
- EPS growth is expected to return in the third quarter with a 10% rise on the year, whilst revenue also quickens to a 31% pace
- International: This arm is making money for the first time since 2017 as the company gradually shifts priority towards profitability from growth. Any sign that Netflix is backing away from rising overseas income would be unwelcome
- Release schedule: The well-publicised departure of popular series like “Friends”, set for 2020 and “The Office” in 2021, has made some waves, especially as the second quarter line-up was subdued. Still, programming is set to revive from Q3. Investors will be keen to hear management comments on the likelihood of another blockbuster subscriber build from new content:
Series 3 of “Stranger Things” began on 4th July with a record 41 million viewers in just four days
A slate of 5 major series is planned between mid-July and late-September, including the last season of “Orange is the New Black”
Netflix has also pencilled in a Q3 launch for series-three of crime drama “Ozarks”, the most popular streaming show of summer 2017
A third season of “The Crown” is slated for Q4
Possible share price reaction
Netflix stock’s post earnings moves are widely known to be volatile. The average share price move directly following Netflix earnings over the last 8 quarters has been 6.3% in either direction, according to Bloomberg data. Options implied volatility projects a move of 8.4% within 24 hours of Netflix’s Q2 earnings. A higher than average implied move, among other indicators, suggests traders are bearish ahead of tonight’s results. Still, scope for a surprise in either direction is considerable.
Chart thoughts
Shares have entered a stagnant phase after reclaiming all ground lost during the winter rout. Since the beginning of May, the stock has been listless in a range bound by highs between $383-$386, and a flattish 200-day moving average (‘MA 200’ on the chart below), near $338. The intractability of those peaks is underlined by monthly ‘triple top’ of failures in the region, during September and October 2018 and May this year. That’s not including close passes in March and April. Following those failures, the bias is lower, as corroborated by the Relative Strength Index. As well, price is currently beneath the 21-day exponential average (‘EMA’). This is usually interpreted as a loss of relatively short-term support. Follow-through would probably first target $351-$353, 17th June’s and 18th June’s high and low respectively. Continued lack of traction would then shift attention to the 200-day MA, before 38.2% of December-May’s advance at $326.
Netflix CFD – daily
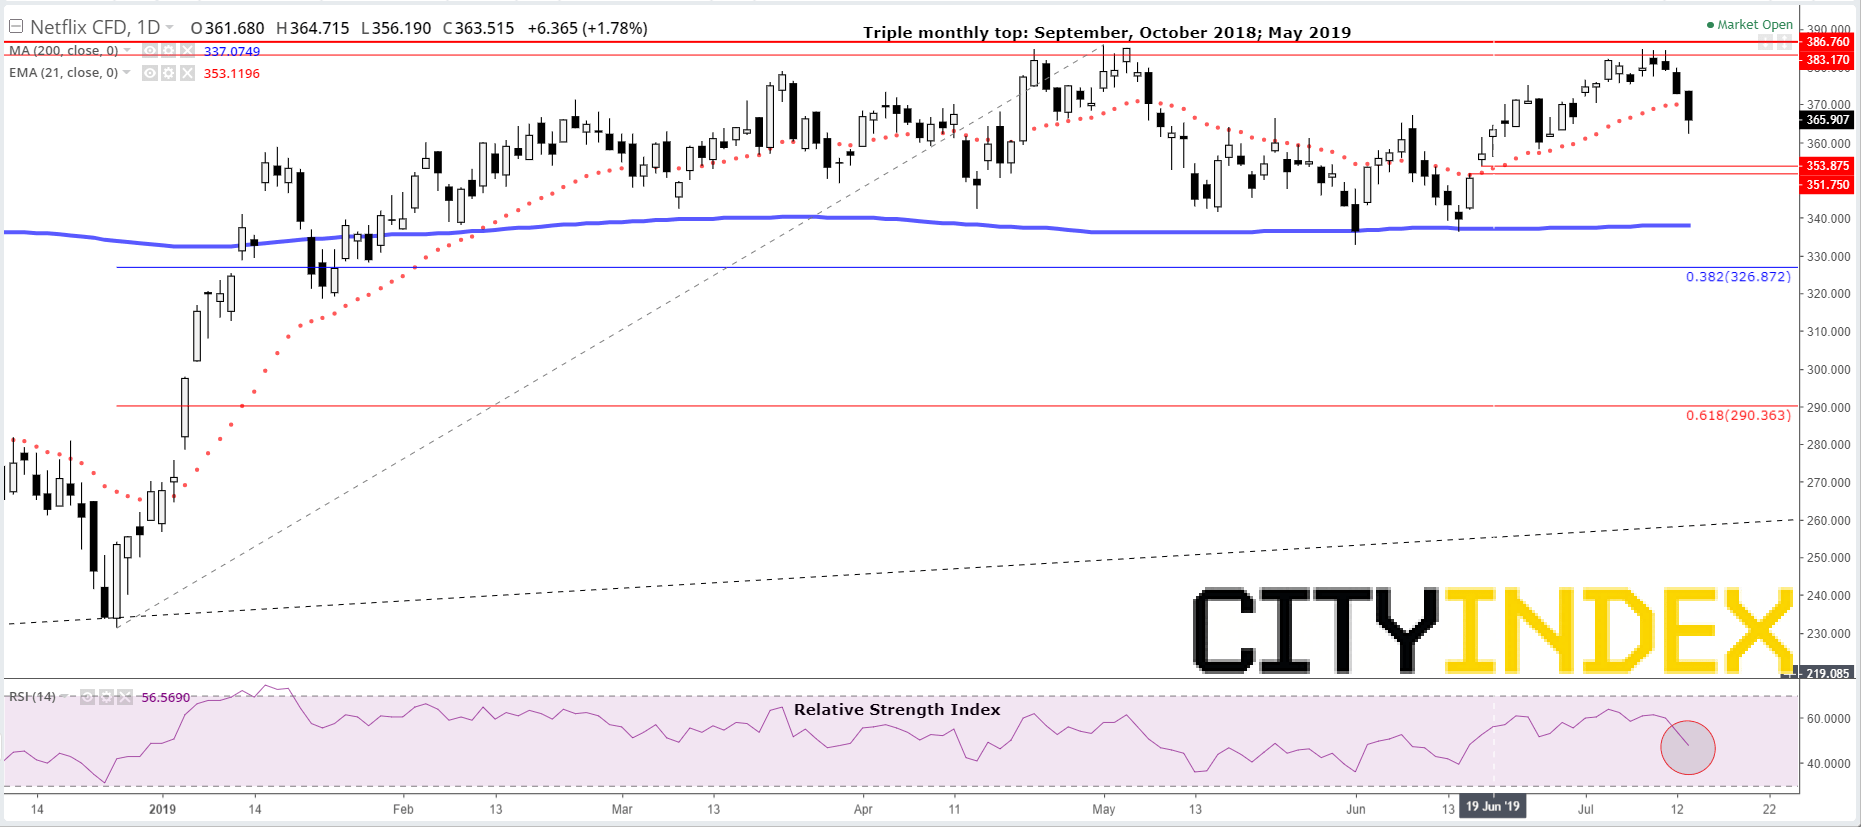
Source: City Index
From time to time, StoneX Financial Pty Ltd (“we”, “our”) website may contain links to other sites and/or resources provided by third parties. These links and/or resources are provided for your information only and we have no control over the contents of those materials, and in no way endorse their content. Any analysis, opinion, commentary or research-based material on our website is for information and educational purposes only and is not, in any circumstances, intended to be an offer, recommendation or solicitation to buy or sell. You should always seek independent advice as to your suitability to speculate in any related markets and your ability to assume the associated risks, if you are at all unsure. No representation or warranty is made, express or implied, that the materials on our website are complete or accurate. We are not under any obligation to update any such material.
As such, we (and/or our associated companies) will not be responsible or liable for any loss or damage incurred by you or any third party arising out of, or in connection with, any use of the information on our website (other than with regards to any duty or liability that we are unable to limit or exclude by law or under the applicable regulatory system) and any such liability is hereby expressly disclaimed.
City Index is a trading name of StoneX Financial Pty Ltd.
The material provided herein is general in nature and does not take into account your objectives, financial situation or needs.
While every care has been taken in preparing this material, we do not provide any representation or warranty (express or implied) with respect to its completeness or accuracy. This is not an invitation or an offer to invest nor is it a recommendation to buy or sell investments.
StoneX recommends you to seek independent financial and legal advice before making any financial investment decision. Trading CFDs and FX on margin carries a higher level of risk, and may not be suitable for all investors. The possibility exists that you could lose more than your initial investment further CFD investors do not own or have any rights to the underlying assets.
It is important you consider our Financial Services Guide and Product Disclosure Statement (PDS) available at www.cityindex.com/en-au/terms-and-policies/, before deciding to acquire or hold our products. As a part of our market risk management, we may take the opposite side of your trade. Our Target Market Determination (TMD) is also available at www.cityindex.com/en-au/terms-and-policies/.
StoneX Financial Pty Ltd, Suite 28.01, 264 George Street, Sydney, NSW 2000 (ACN 141 774 727, AFSL 345646) is the CFD issuer and our products are traded off exchange.
© City Index 2024