usdjpy looks poised to extend rally fomc minutes eyed 2678522016
The dollar goes from strength to strength as market participants grow more confident in foreseeing a rate rise in the US before the year is out. If the FOMC’s last policy meeting minutes, due to be published later on today, convey a more hawkish tone than what the market is expecting then this will only increase rate hike expectations further. Not only has US data steadily improved in recent months, the probability that Hillary Clinton – rather than Donald Trump – will become the next US President has also been rising in the wake of the second TV debate. Only a shock victory for Trump would probably derail the dollar rally, as we don’t expect US data to all of a sudden turn weak in these last few of months of 2016. And as I have been banging on about it over the past couple of weeks, almost every other major central bank except the Fed will most likely remain dovish for some time yet. This is why we have seen strong downward moves in the likes of the GBP/USD, EUR/USD and NZD/USD, while the USD/CHF and USD/JPY have appreciated.
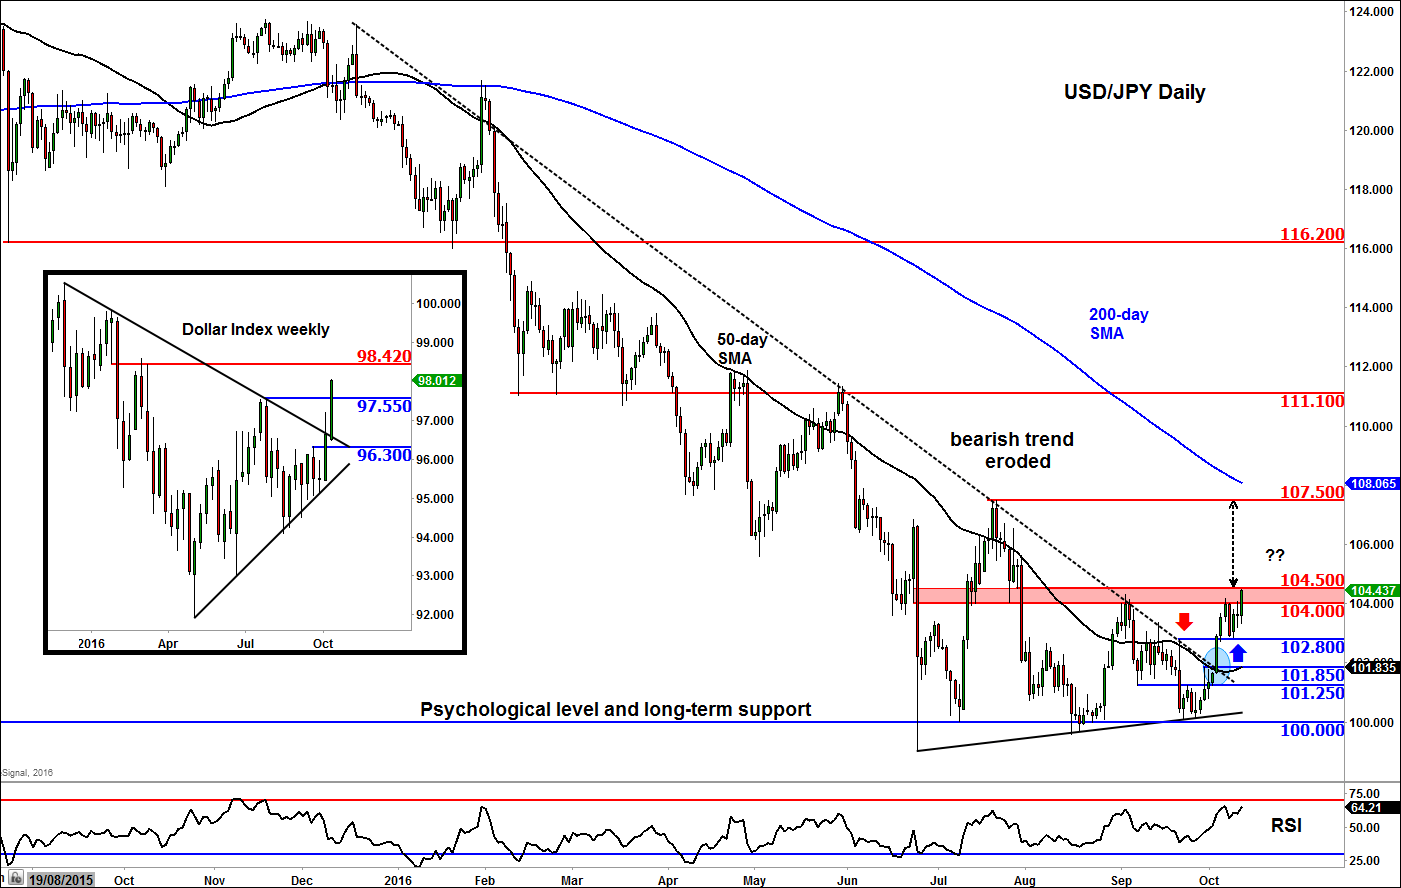
In fact we wrote about the prospects of a rally in the USD/JPY even before the moves happened. Specifically, we highlighted the technical importance of the 100-101 area, which as well as representing a psychological level (100) was also a significant support area in the past. The updated chart of the USD/JPY, below, shows that a key downward trend has now broken down and several resistance levels have been taken out, too. The short-term path of least resistance is clearly to the upside. As such, I wouldn’t be surprised if the key 104.00-104.500 resistance area, which was being tested at the time of this writing, also breaks down soon – though ahead of the FOMC minutes, we may see some profit-taking from the longs.
If the USD/JPY pushes onwards and upwards as we expect it might then the next bullish objective could either be at the 107.50 area – which represents the prior swing high – or at 108.05, where the 200-day moving average comes into play. At this stage, a closing break below short-term support at 102.80 is required to invalidate this short-term bullish outlook. Should that happen, then the support levels at 101.85, 101.25 and 100.00 would become the next price objectives for the bears.
From time to time, StoneX Financial Pty Ltd (“we”, “our”) website may contain links to other sites and/or resources provided by third parties. These links and/or resources are provided for your information only and we have no control over the contents of those materials, and in no way endorse their content. Any analysis, opinion, commentary or research-based material on our website is for information and educational purposes only and is not, in any circumstances, intended to be an offer, recommendation or solicitation to buy or sell. You should always seek independent advice as to your suitability to speculate in any related markets and your ability to assume the associated risks, if you are at all unsure. No representation or warranty is made, express or implied, that the materials on our website are complete or accurate. We are not under any obligation to update any such material.
As such, we (and/or our associated companies) will not be responsible or liable for any loss or damage incurred by you or any third party arising out of, or in connection with, any use of the information on our website (other than with regards to any duty or liability that we are unable to limit or exclude by law or under the applicable regulatory system) and any such liability is hereby expressly disclaimed.
City Index is a trading name of StoneX Financial Pty Ltd.
The material provided herein is general in nature and does not take into account your objectives, financial situation or needs.
While every care has been taken in preparing this material, we do not provide any representation or warranty (express or implied) with respect to its completeness or accuracy. This is not an invitation or an offer to invest nor is it a recommendation to buy or sell investments.
StoneX recommends you to seek independent financial and legal advice before making any financial investment decision. Trading CFDs and FX on margin carries a higher level of risk, and may not be suitable for all investors. The possibility exists that you could lose more than your initial investment further CFD investors do not own or have any rights to the underlying assets.
It is important you consider our Financial Services Guide and Product Disclosure Statement (PDS) available at www.cityindex.com/en-au/terms-and-policies/, before deciding to acquire or hold our products. As a part of our market risk management, we may take the opposite side of your trade. Our Target Market Determination (TMD) is also available at www.cityindex.com/en-au/terms-and-policies/.
StoneX Financial Pty Ltd, Suite 28.01, 264 George Street, Sydney, NSW 2000 (ACN 141 774 727, AFSL 345646) is the CFD issuer and our products are traded off exchange.
© City Index 2024