usdchf coiling for a big breakout 2669122016
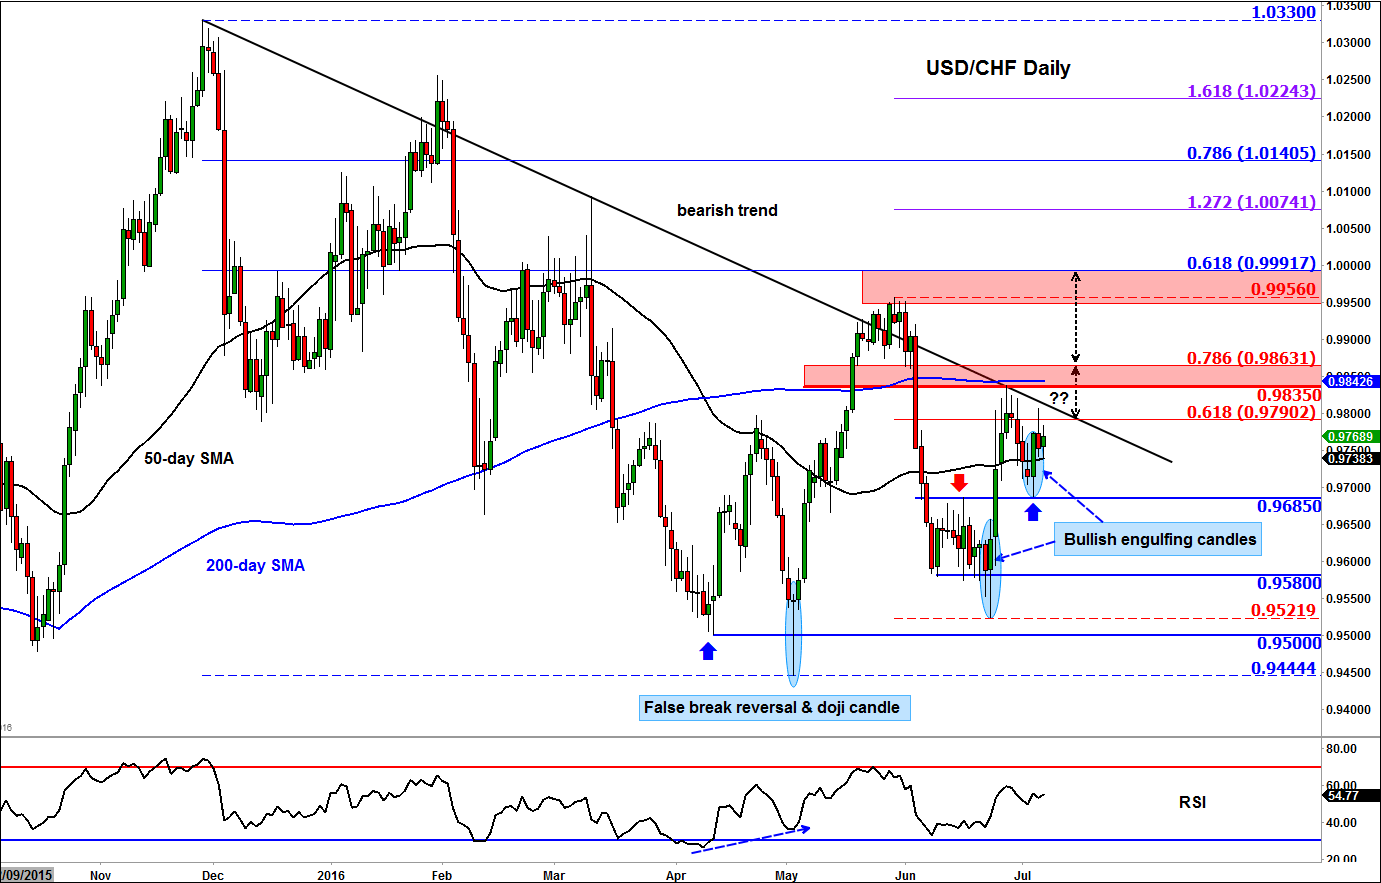
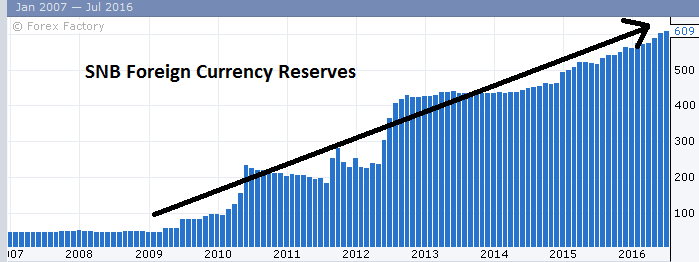
The daily chart of the USD/CHF (figure 1) continues to show constructive technical signals as far as the bullish case is concerned. Obviously the biggest risk to any technical outlook is sudden changes in sentiment because of some fundamental stimuli, such as the ongoing Brexit risks and Friday’s US jobs report among others. But with the SNB actively intervening in the FX markets (as indicated by the ballooning foreign currency reserves, which rose a further 7 billion francs in June to 609 billion – see the chart in figure 2) and the Fed still being the only major central bank looking to raise rather than cut interest rates (at some point), the fundamental outlook for the Swissy continues to remain bullish. It looks like all the USD/CHF needs now is just a push to trigger potential momentum buying interest and this trigger could come in the form of a solid NFP report on Friday.
As can be seen, the key reversal day was actually back in May 3 when price broke below the prior low at 0.9500, but finished the day significantly above this psychologically-important level, around where it had opened. As a result, a false break reversal pattern was formed with price also showing a doji candlestick formation, which is typically found near trend extremes. A sharp rally then followed as the sellers abandoned their positions and new buyers stepped in. This rebound eventually came to an end near the bearish trend line and the break above the 200-day moving average proved to be a temporary one. But then another rally initiated following a lengthy pause in the 0.9580-0.9685 range. Once again, there was a false break down scenario where the bears’ attempts to push price below this range was rejected, resulting in a bullish engulfing candle and a subsequent bounce. This rally also came to a halt around the bearish trend line but the corresponding dip was bought this Tuesday at the top of the former range i.e. 0.9685 where price formed another bullish engulfing candle.
So within the larger consolidation pattern, there are bullish signs emerging that suggest a bullish breakout could be on the cards soon. Conservative trend traders may wish to wait for this potential scenario to unfold before jumping on the bandwagon, while for the shorter-term-focused speculators there should be plenty of opportunities to take advantage of even before that potential bullish breakout occurs. Some of the potential levels of support and resistance are shown on the chart in blue and red, respectively. It will be a bearish outcome should the Swissy move back below 0.9685 support.
From time to time, StoneX Financial Pty Ltd (“we”, “our”) website may contain links to other sites and/or resources provided by third parties. These links and/or resources are provided for your information only and we have no control over the contents of those materials, and in no way endorse their content. Any analysis, opinion, commentary or research-based material on our website is for information and educational purposes only and is not, in any circumstances, intended to be an offer, recommendation or solicitation to buy or sell. You should always seek independent advice as to your suitability to speculate in any related markets and your ability to assume the associated risks, if you are at all unsure. No representation or warranty is made, express or implied, that the materials on our website are complete or accurate. We are not under any obligation to update any such material.
As such, we (and/or our associated companies) will not be responsible or liable for any loss or damage incurred by you or any third party arising out of, or in connection with, any use of the information on our website (other than with regards to any duty or liability that we are unable to limit or exclude by law or under the applicable regulatory system) and any such liability is hereby expressly disclaimed.
City Index is a trading name of StoneX Financial Pty Ltd.
The material provided herein is general in nature and does not take into account your objectives, financial situation or needs.
While every care has been taken in preparing this material, we do not provide any representation or warranty (express or implied) with respect to its completeness or accuracy. This is not an invitation or an offer to invest nor is it a recommendation to buy or sell investments.
StoneX recommends you to seek independent financial and legal advice before making any financial investment decision. Trading CFDs and FX on margin carries a higher level of risk, and may not be suitable for all investors. The possibility exists that you could lose more than your initial investment further CFD investors do not own or have any rights to the underlying assets.
It is important you consider our Financial Services Guide and Product Disclosure Statement (PDS) available at www.cityindex.com/en-au/terms-and-policies/, before deciding to acquire or hold our products. As a part of our market risk management, we may take the opposite side of your trade. Our Target Market Determination (TMD) is also available at www.cityindex.com/en-au/terms-and-policies/.
StoneX Financial Pty Ltd, Suite 28.01, 264 George Street, Sydney, NSW 2000 (ACN 141 774 727, AFSL 345646) is the CFD issuer and our products are traded off exchange.
© City Index 2024