UK tied stocks arent tied down by sterling
Mid-cap focused FTSE 250 can extend outperformance vs. FTSE 100 even if sterling stays weak
UK-centric assets were in the spotlight on Friday, helped by optimism that Brussels and London are on the scent of a Brexit deal. Ireland’s foreign Minister Simon Coveney served a reality check, though, noting that a Brexit deal is “not close”.
The pound duly returned most of it 0.8% gain to its highest levels since July. It traded around $1.25 again at last check from closer to $1.26 earlier. Its slide trimmed rallies of Brexit-sensitive markets like Britain’s FTSE 250 for a while. The mid-cap index’s constituents generate more of their revenues in the United Kingdom (now about 46%, according to FactSet) than the FTSE 100 benchmark (around 23%). MCX slipped to a gain of as little as a tenth of a percentage point though eventually recouped to close 0.4% higher, with the FTSE 100 ending a tad lower. Initial rebounds by consumer-tied sectors like housebuilders and retailers also partially unwound.
Still, with the FTSE 250 reasserting its long-term outperformance of the FTSE 100 so far this year, does the mid-cap gauge even need a sterling rally these days in order to strive? It’s worth noting that FTSE 250 firms now make less of their sales in Britain than in recent history—about 46% in 2018, according to FactSet. That compares with closer to 60% within the past decade. FactSet pegs the FTSE 100’s UK revenues at 24%.
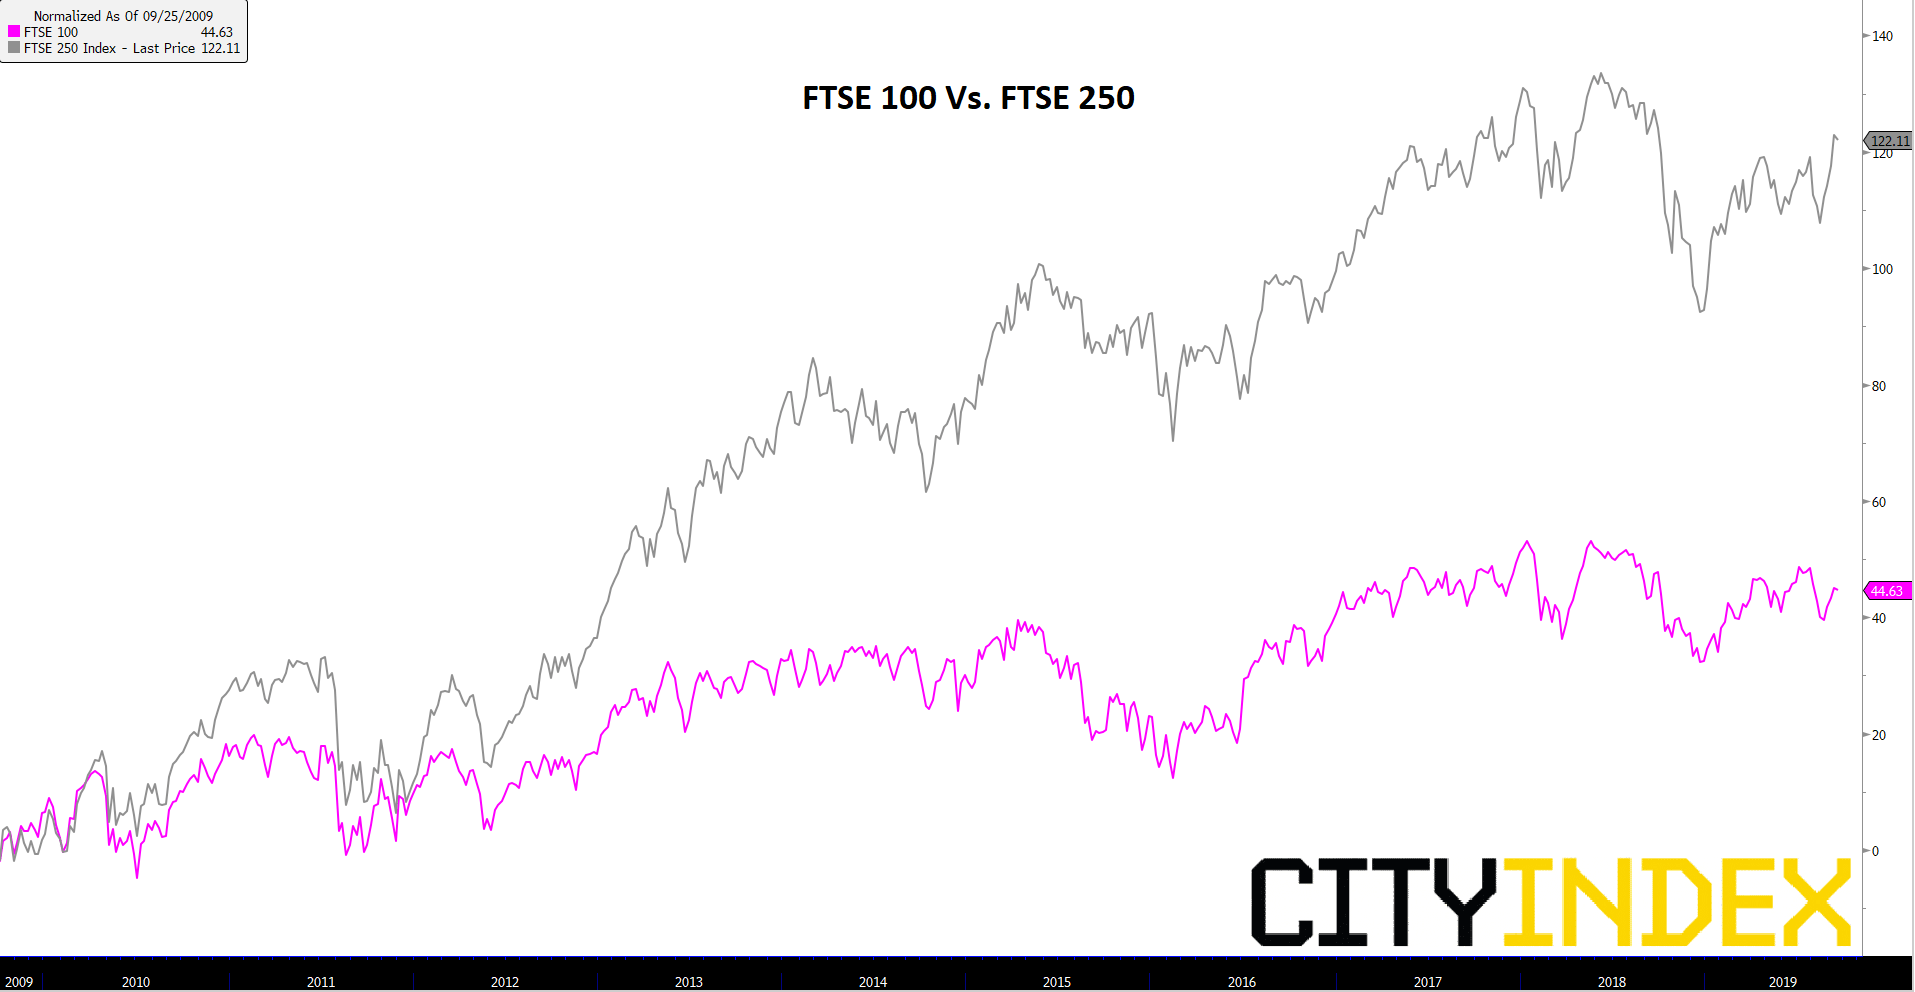
As demonstrated on Friday, a weakened link to sterling doesn’t exempt the FTSE 250 from Brexit related turbulence. On the other hand, whilst Britain’s ‘lower-tier’ market was initially dented by Britain’s vote to leave the European Union, the index has certainly not been weighed down by the pound relative to its counterpart, the FTSE 100. The two UK indices are normalised over a decade in the chart below.
Normalised chart: FTSE 100; FTSE 250 – 25-09-2019 to date
Source: Bloomberg/City Index
We can rationalise the FTSE 250’s strength relative to the benchmark in many ways. For one, perhaps the mid-cap markets’ composition of more ‘growth’ shares than the stodgy FTSE 100 give it the edge. This edge seems resilient too. As Brexit reached a crescendo this year the MCX barely kept its lead against UKX. Yet over the last month, the FTSE 250 is again pulling definitively ahead. The FTSE 250 has risen 15% so far this year whilst the FTSE 100 is up 9%.
From a chart perspective, resumption of MCX strength relative to UKX appears to be at an early stage, though it shows promise. The FTSE 250/FTSE 100 spread broke below its bullish long-term channel late last year. However it has sustained an upswing since then and looks on course to re-enter the structure. If it does, the market can be expected to extend its uptrend further, possibly to the detriment of the FTSE 100. The FTSE could only get the upper hand if the FTSE 250 fails to regain its prior trend in the medium term.
FTSE 250 / FTSE 100 spread – weekly
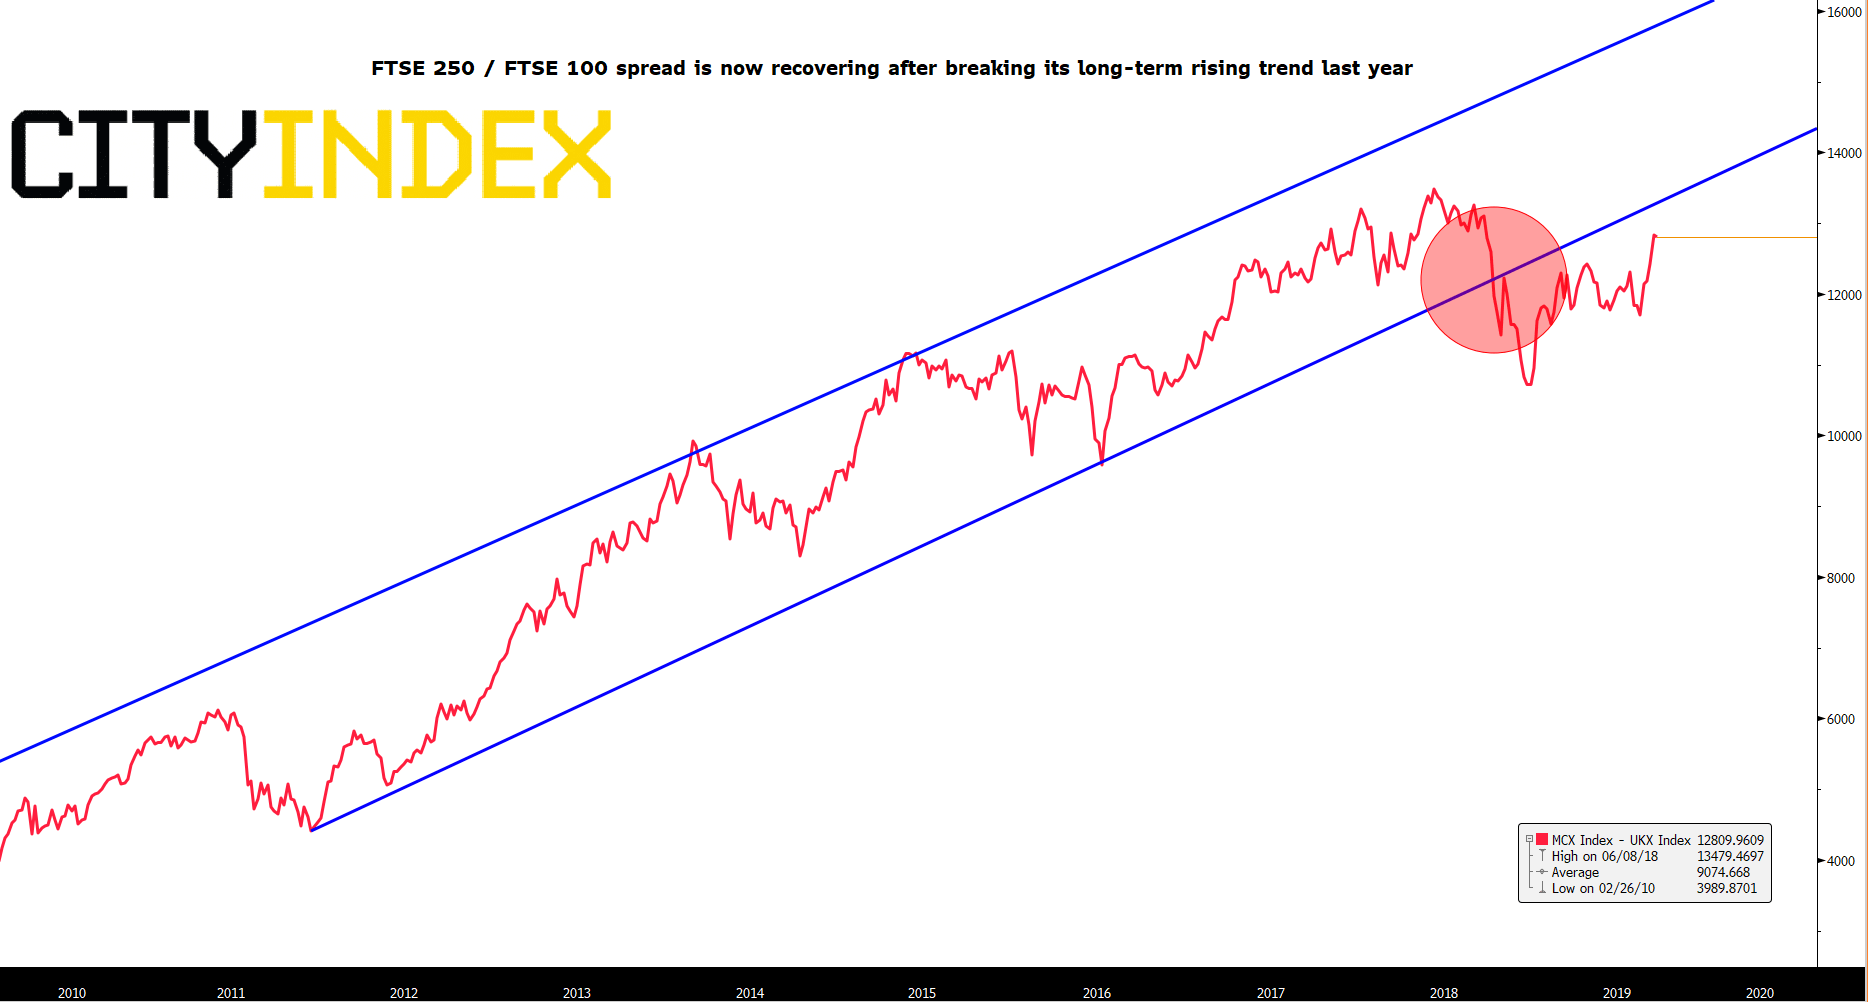
Source: Bloomberg/City Index
From time to time, StoneX Financial Pty Ltd (“we”, “our”) website may contain links to other sites and/or resources provided by third parties. These links and/or resources are provided for your information only and we have no control over the contents of those materials, and in no way endorse their content. Any analysis, opinion, commentary or research-based material on our website is for information and educational purposes only and is not, in any circumstances, intended to be an offer, recommendation or solicitation to buy or sell. You should always seek independent advice as to your suitability to speculate in any related markets and your ability to assume the associated risks, if you are at all unsure. No representation or warranty is made, express or implied, that the materials on our website are complete or accurate. We are not under any obligation to update any such material.
As such, we (and/or our associated companies) will not be responsible or liable for any loss or damage incurred by you or any third party arising out of, or in connection with, any use of the information on our website (other than with regards to any duty or liability that we are unable to limit or exclude by law or under the applicable regulatory system) and any such liability is hereby expressly disclaimed.
City Index is a trading name of StoneX Financial Pty Ltd.
The material provided herein is general in nature and does not take into account your objectives, financial situation or needs.
While every care has been taken in preparing this material, we do not provide any representation or warranty (express or implied) with respect to its completeness or accuracy. This is not an invitation or an offer to invest nor is it a recommendation to buy or sell investments.
StoneX recommends you to seek independent financial and legal advice before making any financial investment decision. Trading CFDs and FX on margin carries a higher level of risk, and may not be suitable for all investors. The possibility exists that you could lose more than your initial investment further CFD investors do not own or have any rights to the underlying assets.
It is important you consider our Financial Services Guide and Product Disclosure Statement (PDS) available at www.cityindex.com/en-au/terms-and-policies/, before deciding to acquire or hold our products. As a part of our market risk management, we may take the opposite side of your trade. Our Target Market Determination (TMD) is also available at www.cityindex.com/en-au/terms-and-policies/.
StoneX Financial Pty Ltd, Suite 28.01, 264 George Street, Sydney, NSW 2000 (ACN 141 774 727, AFSL 345646) is the CFD issuer and our products are traded off exchange.
© City Index 2024