Sunsetting on a golden run
Despite expectations to the contrary, it turned out to be a relatively orderly month-end. Warnings such as the one from the Global Foreign Exchange Committee highlighted earlier in the week, appear to have prompted institutional participants to transact their rebalancing flows over a longer period, rather than leave them all until the last day of the month.
Without the anticipated end of month buying, U.S. equities retraced lower. The S&P 500 falling over 1.50%, ignoring chatter of a “Phase 4” COVID-19 stimulus relief plan, a U.S $2tn spending package on new infrastructure. Whether an infrastructure bill would receive bipartisan support remains to be seen as historically both sides have disagreed on how best to fund these types of measures.
Also falling overnight, gold, following reports that the Russian Central Bank, who have accumulated $U.S 40 billion of gold over the past five years, would cease buying gold from April 1st. While no explanation accompanied the news it is thought that the Russia along with other crude oil-producing countries, currently reeling from a crude oil price war and soft demand, might sell gold reserves to increase cash reserves.
While the underlying macro picture remains supportive of gold i.e. COVID-19 concerns and unprecedented monetary easings, the news out of Russia does remove a pillar of support for gold. This subtle macro change can be noticed on the chart below.
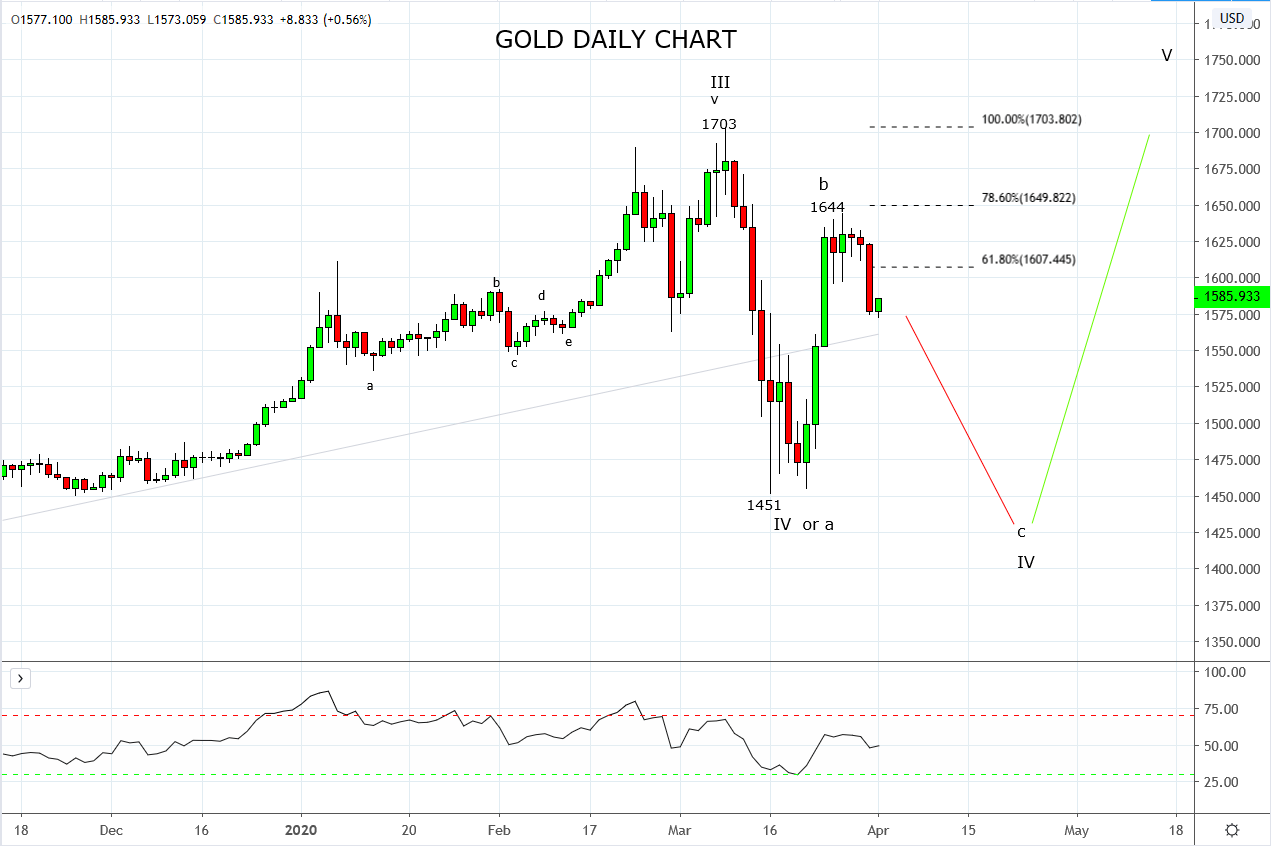
Following golds dramatic fall from the$1703 high, it held and bounced from the support at $1451 which was the 38.2% Fibonacci retracement of the move from December 2015, $1046 low to the recent $1703 high. This led to an expectation written about on the 18th of March for a move higher in gold as outlined below.
“After this week’s pullback to the $1451 low that neatly tagged the 38.2% Fibonacci retracement of the rally from the $1046 low from 2015 to the $1703 high from two weeks ago and with positioning much cleaner after the recent flush AND with more fiscal and easing reasons than previously, we feel gold is well placed to recover lost ground.”
However, the rally from the $1451 low stalled and now begun to reverse from ahead of resistance near $1650, which comes from the 78.6% Fibonacci retracement of the fall from $1703 to $1451.
The price action seen overnight warns that gold has commenced Wave C of Wave IV lower, towards $1400 a move that ultimately should present an excellent buying opportunity. We will remain with this lower before higher view unless gold breaks back above resistance at $1650ish.
Source Tradingview. The figures stated areas of the 1st of April 2020. Past performance is not a reliable indicator of future performance. This report does not contain and is not to be taken as containing any financial product advice or financial product recommendation
From time to time, StoneX Financial Pty Ltd (“we”, “our”) website may contain links to other sites and/or resources provided by third parties. These links and/or resources are provided for your information only and we have no control over the contents of those materials, and in no way endorse their content. Any analysis, opinion, commentary or research-based material on our website is for information and educational purposes only and is not, in any circumstances, intended to be an offer, recommendation or solicitation to buy or sell. You should always seek independent advice as to your suitability to speculate in any related markets and your ability to assume the associated risks, if you are at all unsure. No representation or warranty is made, express or implied, that the materials on our website are complete or accurate. We are not under any obligation to update any such material.
As such, we (and/or our associated companies) will not be responsible or liable for any loss or damage incurred by you or any third party arising out of, or in connection with, any use of the information on our website (other than with regards to any duty or liability that we are unable to limit or exclude by law or under the applicable regulatory system) and any such liability is hereby expressly disclaimed.
City Index is a trading name of StoneX Financial Pty Ltd.
The material provided herein is general in nature and does not take into account your objectives, financial situation or needs.
While every care has been taken in preparing this material, we do not provide any representation or warranty (express or implied) with respect to its completeness or accuracy. This is not an invitation or an offer to invest nor is it a recommendation to buy or sell investments.
StoneX recommends you to seek independent financial and legal advice before making any financial investment decision. Trading CFDs and FX on margin carries a higher level of risk, and may not be suitable for all investors. The possibility exists that you could lose more than your initial investment further CFD investors do not own or have any rights to the underlying assets.
It is important you consider our Financial Services Guide and Product Disclosure Statement (PDS) available at www.cityindex.com/en-au/terms-and-policies/, before deciding to acquire or hold our products. As a part of our market risk management, we may take the opposite side of your trade. Our Target Market Determination (TMD) is also available at www.cityindex.com/en-au/terms-and-policies/.
StoneX Financial Pty Ltd, Suite 28.01, 264 George Street, Sydney, NSW 2000 (ACN 141 774 727, AFSL 345646) is the CFD issuer and our products are traded off exchange.
© City Index 2024