Stock Indices Weekly Technical Outlook Bulls Rescued By Verbal Mini Trade Deal
S&P 500 – Further push up to retest all-time high
click to enlarge charts
Key Levels (1 to 3 weeks)
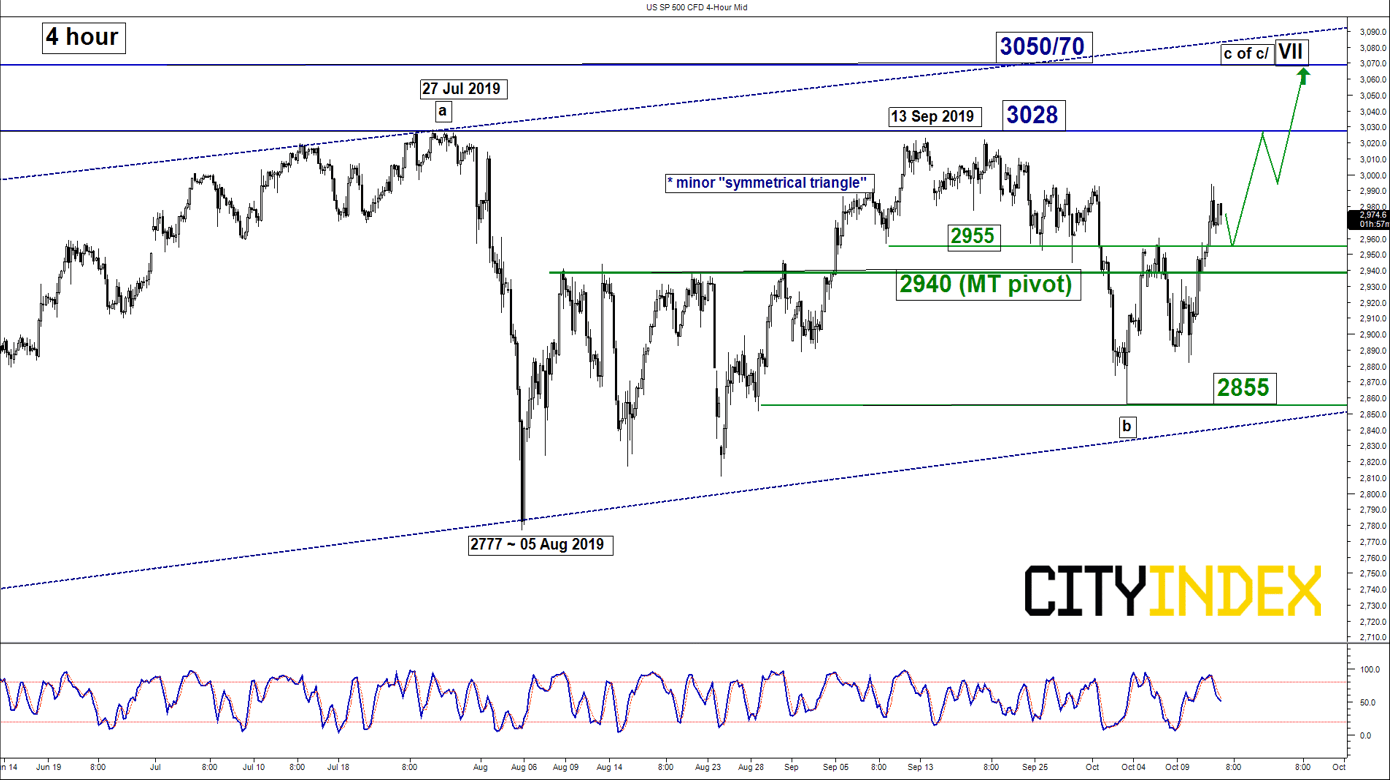
Intermediate support: 2955
Pivot (key support): 2940/35
Resistances: 3028 & 3050/70
Next support: 2855
Directional Bias (1 to 3 weeks)
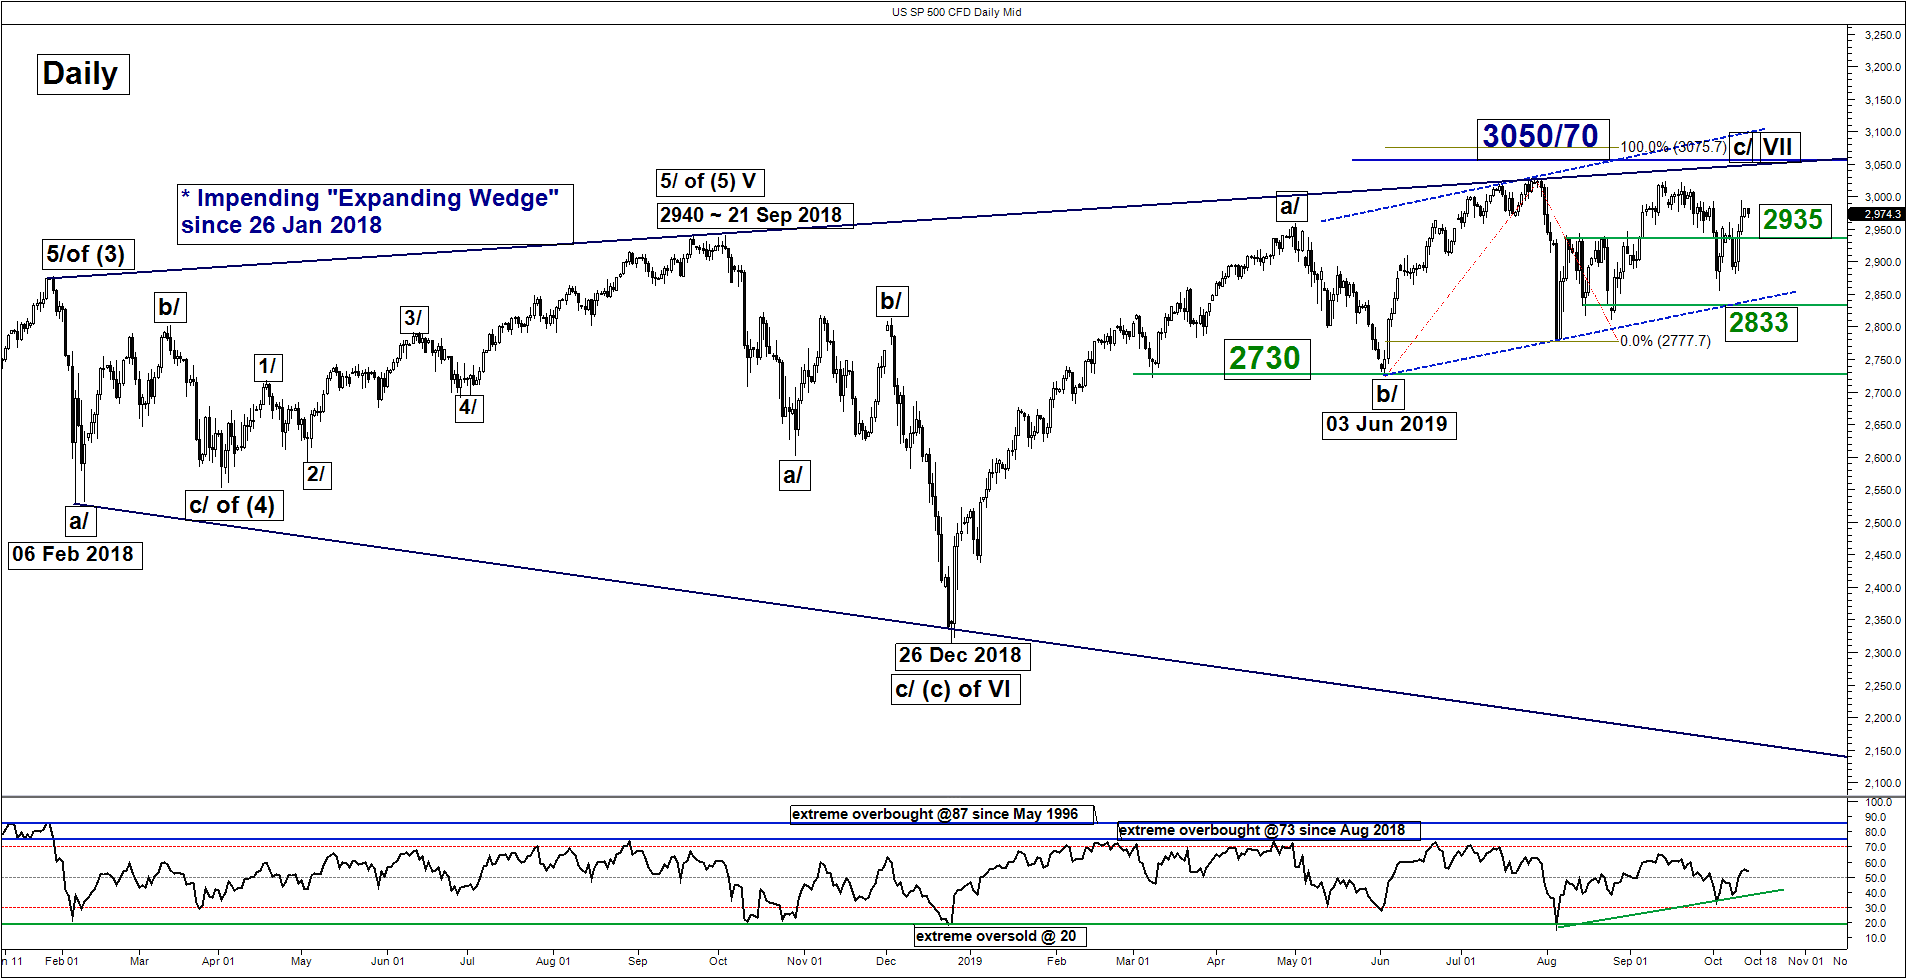
Last Fri 11 Oct, the SP 500 Index (proxy for the S&P 500 futures) has cleared above the upper limit of 2960 neutrality range as per highlighted in our previous report (click here for a recap) on the backdrop of an increase in optimism over phase 1 “mini verbal trade deal” struck between U.S. and China. Flip to a bullish bias in any dips above 2940/35 key medium-term pivotal support for a further potential push up to retest the 3028 current all-time high before targeting a major resistance zone of 3050/70.
On the other hand, a break with a daily close below 2935 invalidates the bullish scenario for another choppy decline towards 2855 (the ascending range support from 03 Jun 2019 low).
Key elements
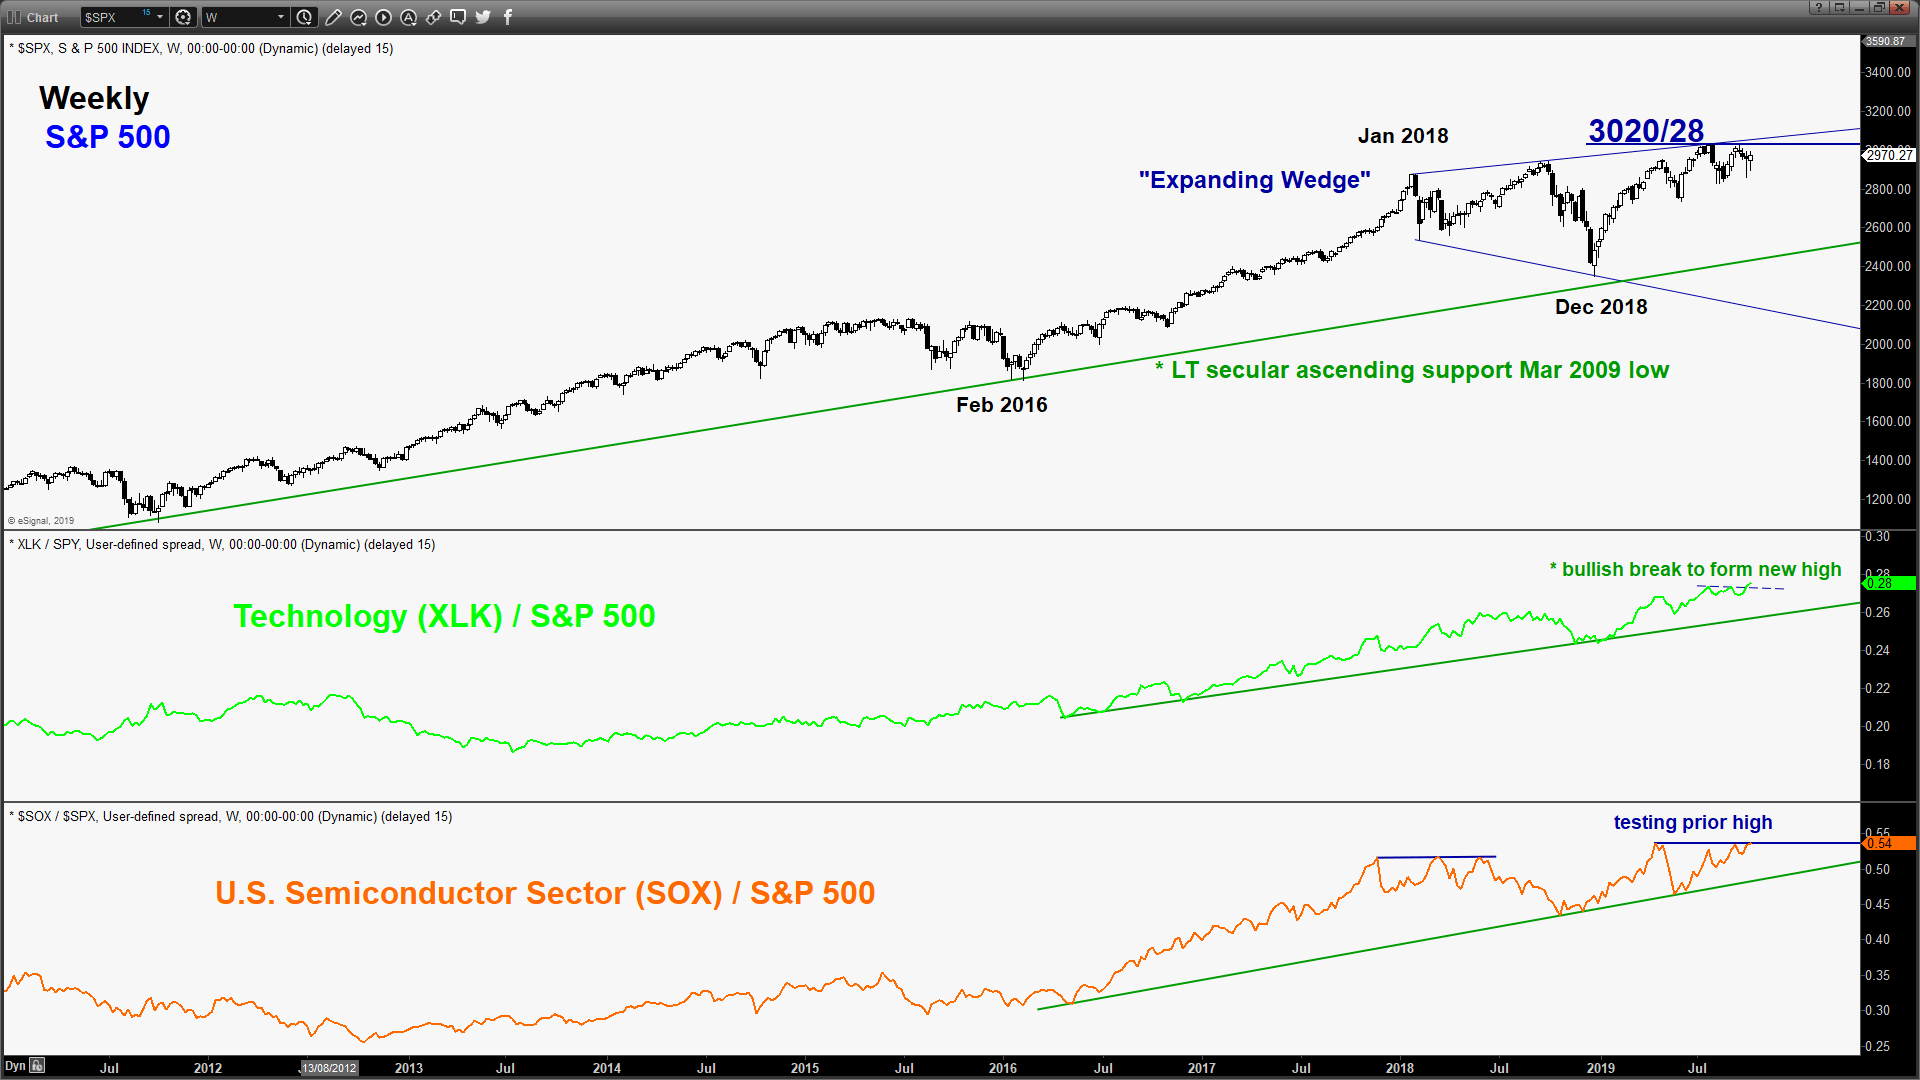
- Since 26 Jan 2018 high, the Index has continued to evolve within a major bearish “Expanding Wedge” configuration with the upper limit now coming in at 3050, also confluences closely with a Fibonacci expansion cluster at 3070.
- The daily RSI oscillator has started to inch upwards above a corresponding ascending support at the 40 level.
- Relative strength analysis has indicated that the Technology sector (XLK), the largest sector with a market weightage of 22% in the S&P 500 has outperformed the S&P 500. Its ratio chart that has staged a bullish breakout to form a new high. This observation suggests the higher-beta Technology sector is now playing a leadership role which is likely to add impetus for the S&P 500 to see further potential upside.
Nikkei 225 – Further potential push up towards major range resistance
click to enlarge charts
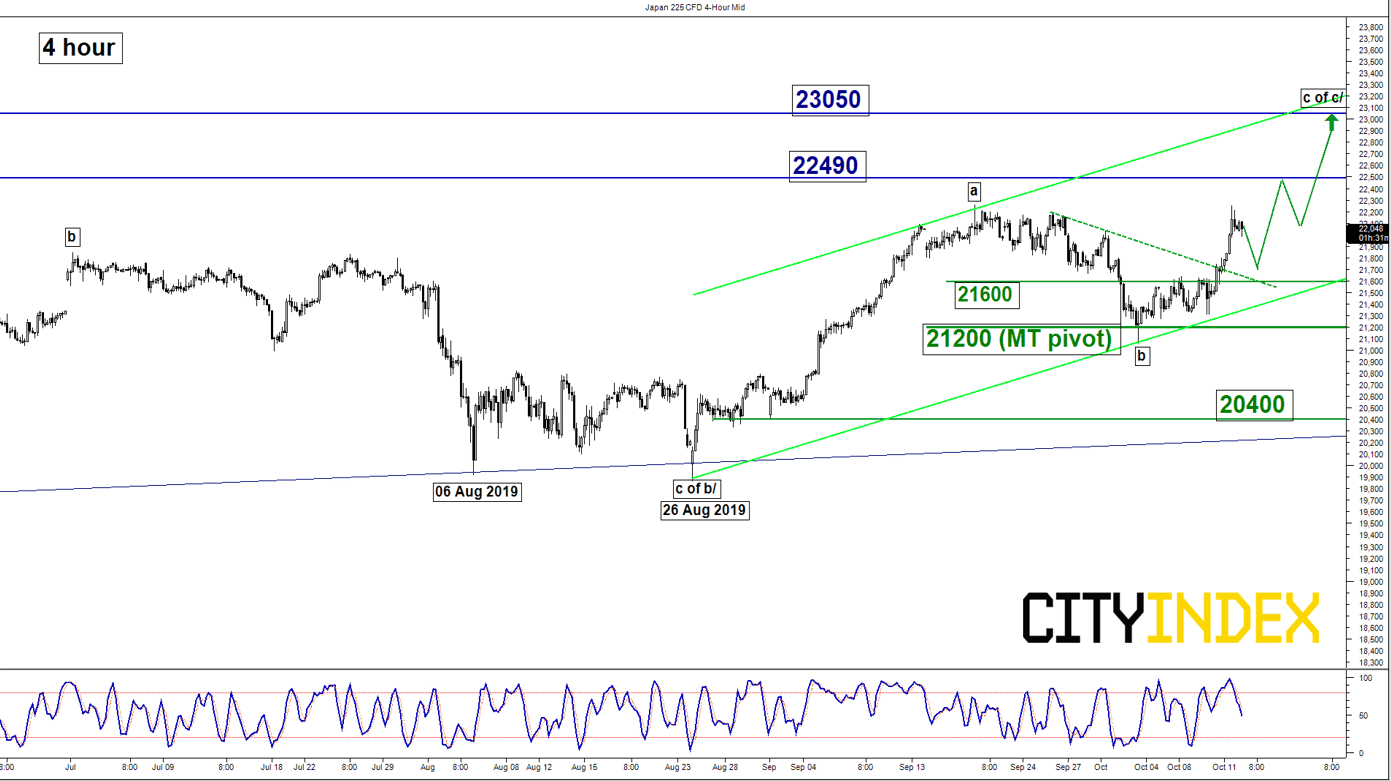
Key Levels (1 to 3 weeks)
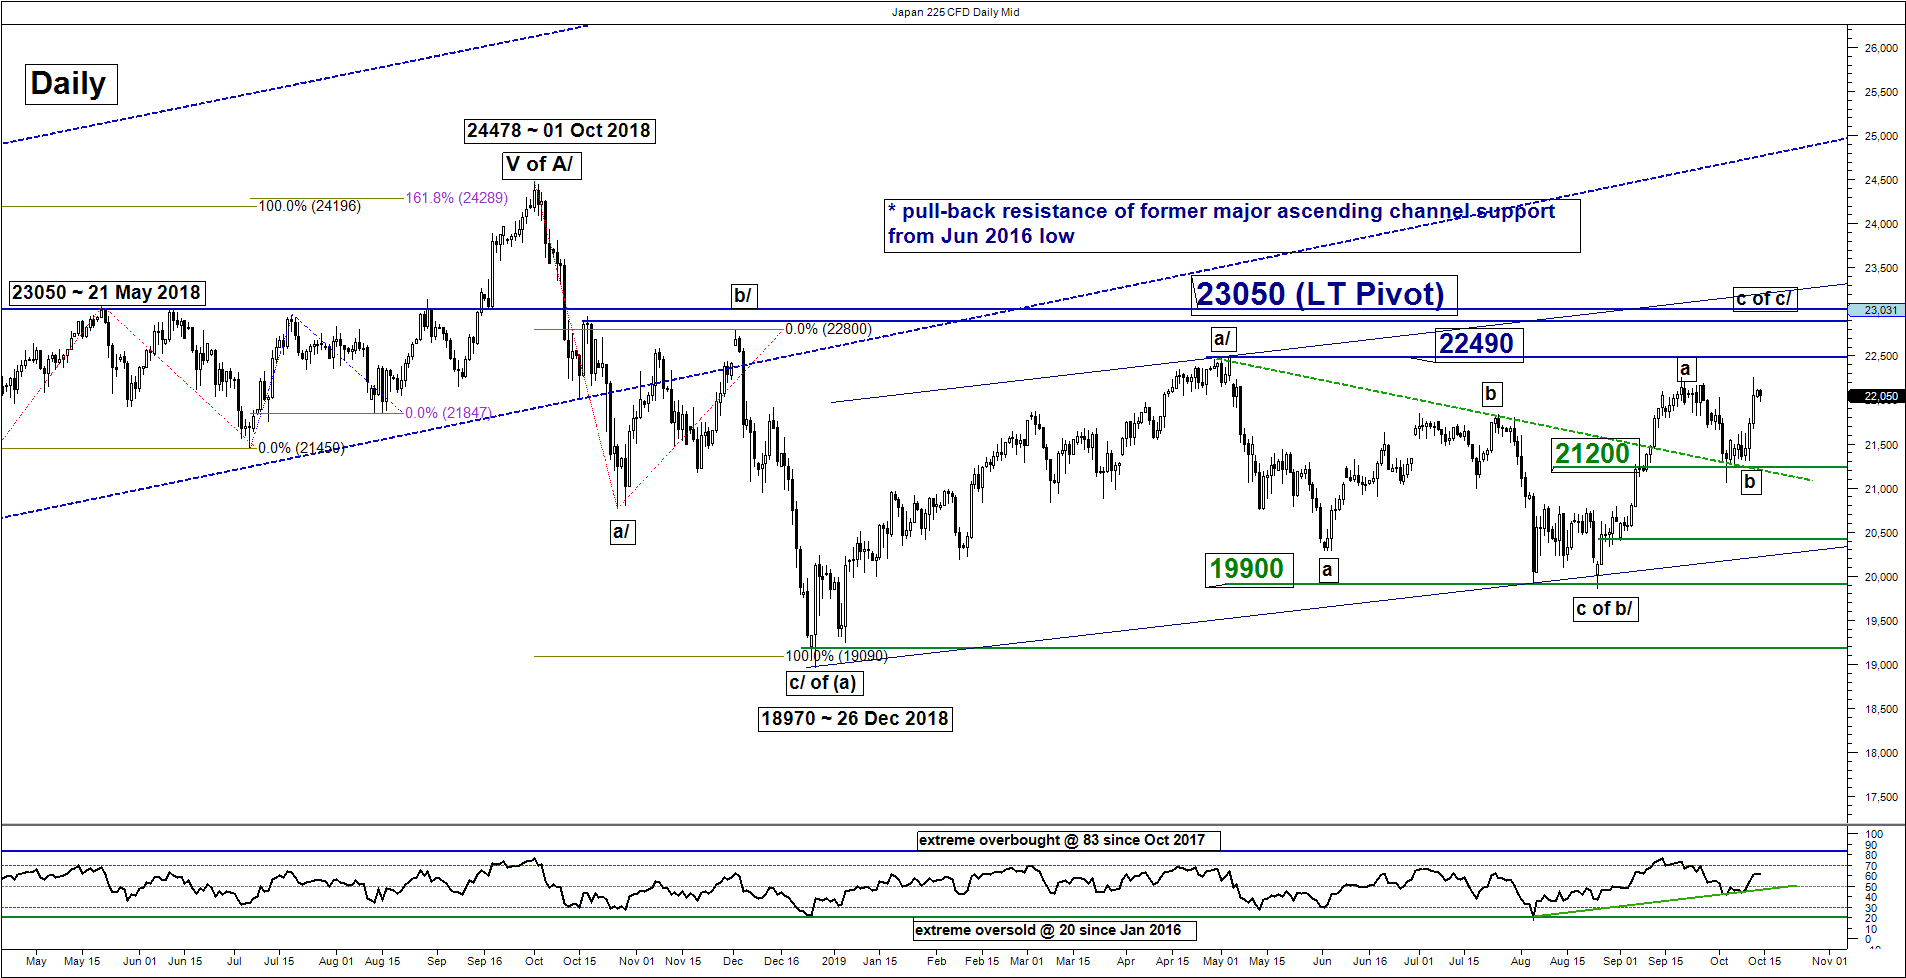
Intermediate support: 21600
Pivot (key support): 21200
Resistances: 22490 & 23050
Next support: 20400
Directional Bias (1 to 3 weeks)
The Japan 225 Index (proxy for the Nikkei 225 futures) has broken above 21750 key medium-term resistance that has invalidated the preferred push down scenario towards the ascending range support of 20400.
Flip to bullish bias now in any dips (as the 4-hour Stochastic oscillator has exited from its overbought region) above 21200 key medium-term pivotal support for a further potential push up towards the 22490 (03 May 2019 high) and 23050 next (upper boundary of a minor ascending channel from 26 Aug 2019 low & the long-term key range resistance).
On the other hand, a break with a daily close below 21200 invalidates the bullish scenario for a slide back towards the 20400 major ascending range support in place since 26 Dec 2018 low.
Hang Seng – Still capped by a medium-term descending trendline
click to enlarge charts
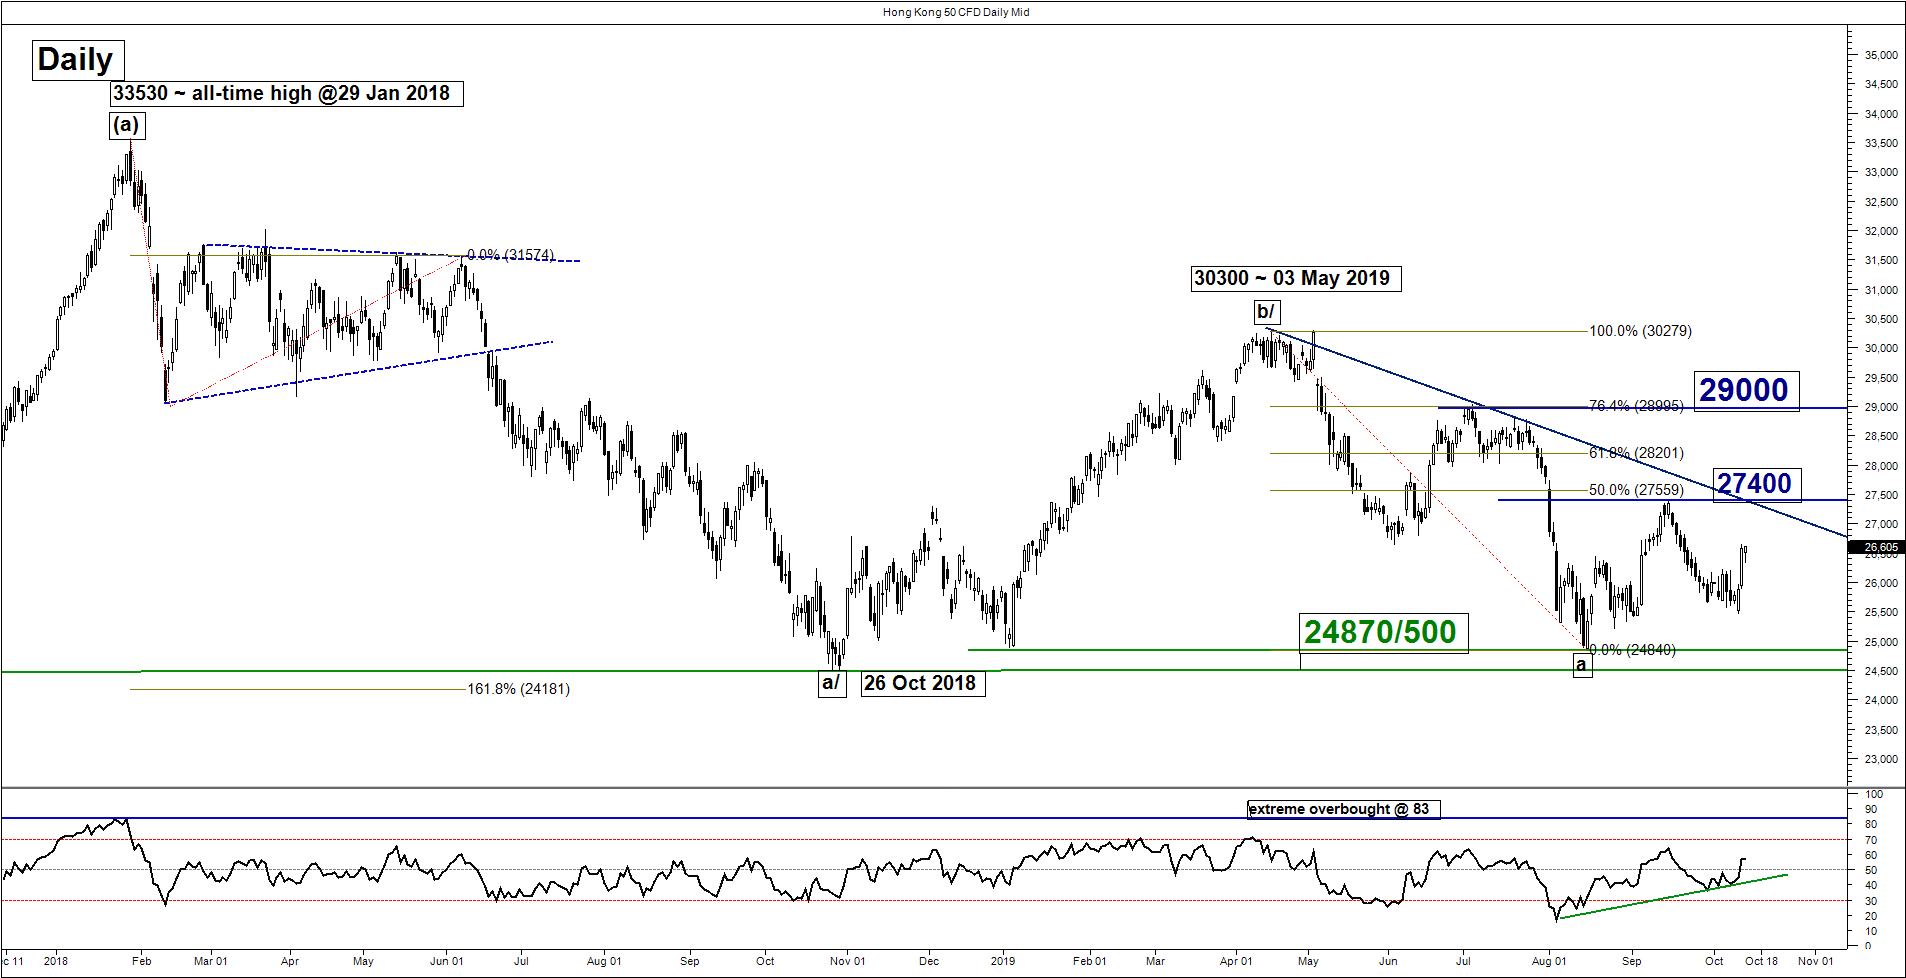
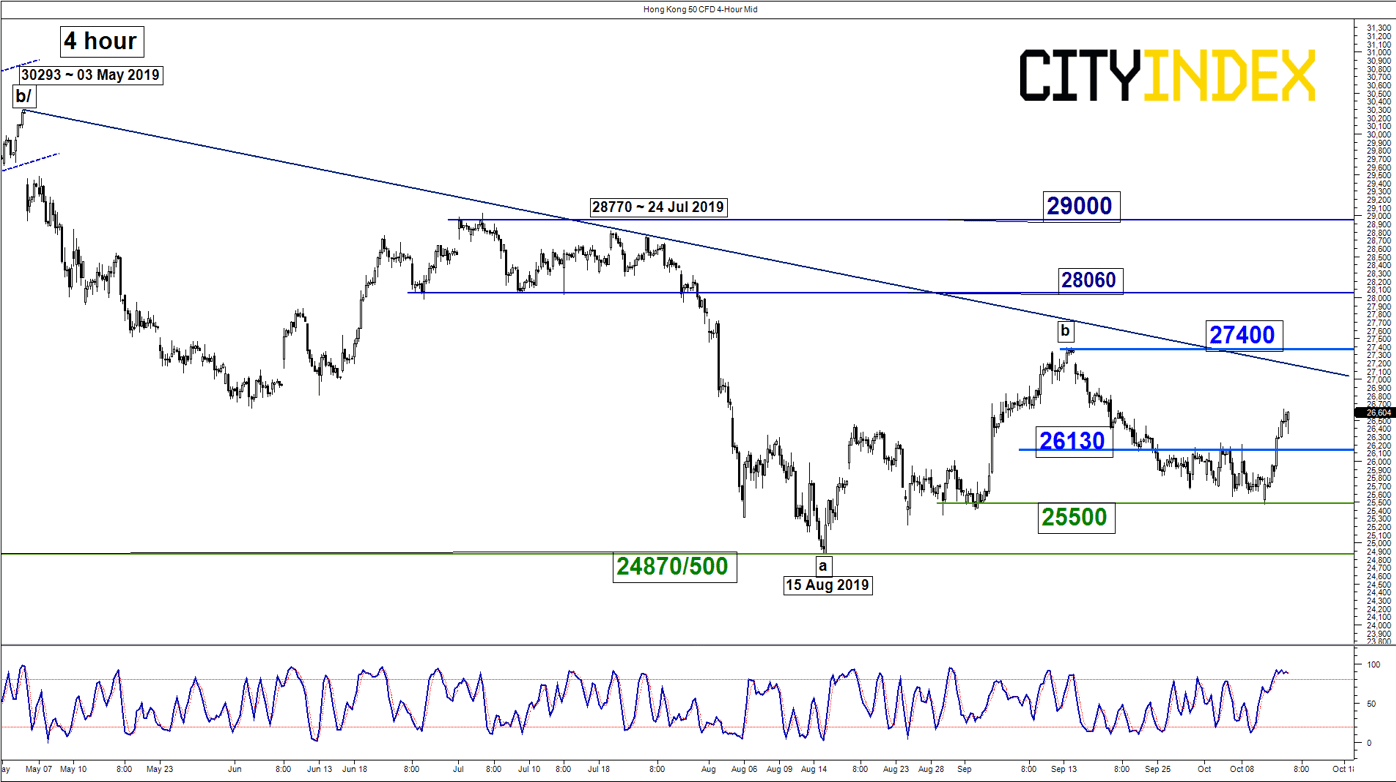
Key Levels (1 to 3 weeks)
Supports: 26130, 25500 & 24870/500
Resistances: 27400, 28060 & 29000
Directional Bias (1 to 3 weeks)
The Hong Kong 50 Index (proxy for Hang Seng Index futures) has broken above the former range resistance of 26500 in place sin 30 Sep 2019 but it still trading below 27400 (descending resistance from 03 May 2019 & 13 Sep 2019 swing high).
Mix elements, prefer to turn neutral now between 27400 and 26130. A clearance above 27400 opens up scope for a further corrective rebound towards 28060 follow by 29000 next (24 Jun 2019 swing high & 76.4% Fibonacci retracement of the previous multi-month decline from 03 May high to 15 Aug 2019 low). On the flipside, a daily close below 26130 revives the bearish tone for a slide to retest last week swing low area of 25500 and even the major range support of 24870/500.
ASX 200 – Mean reversion rebound in progress
click to enlarge charts
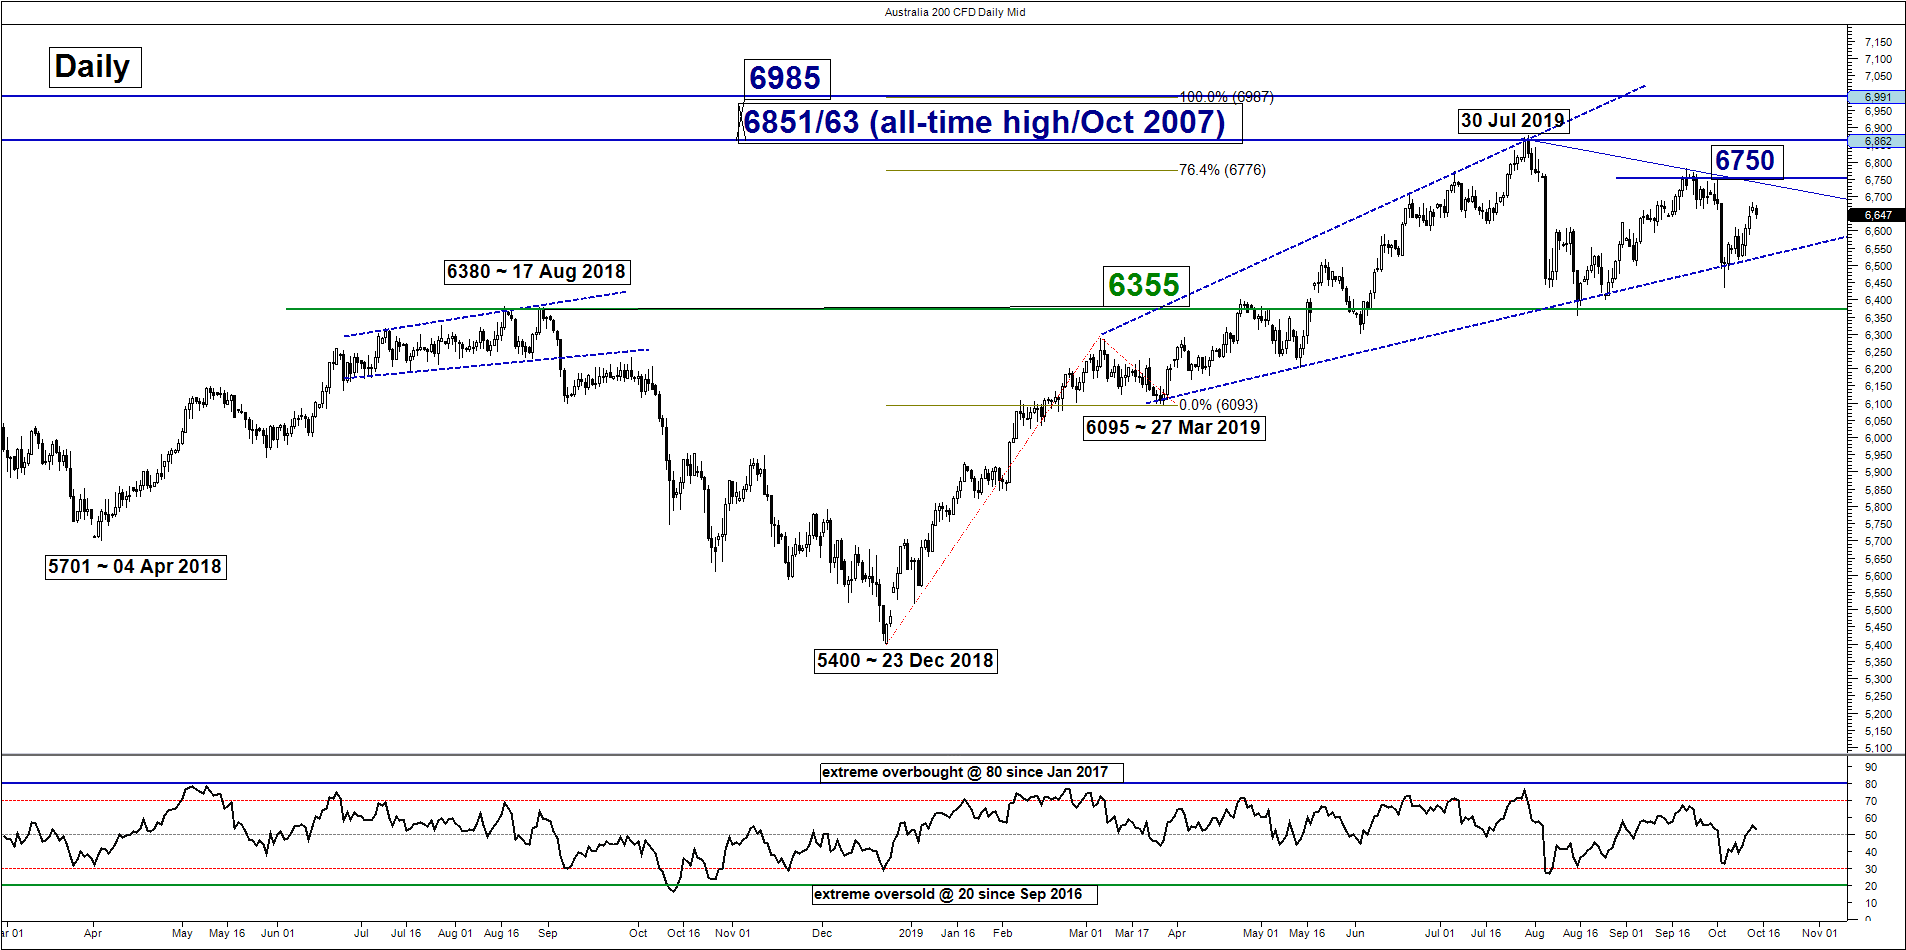
Key Levels (1 to 3 weeks)
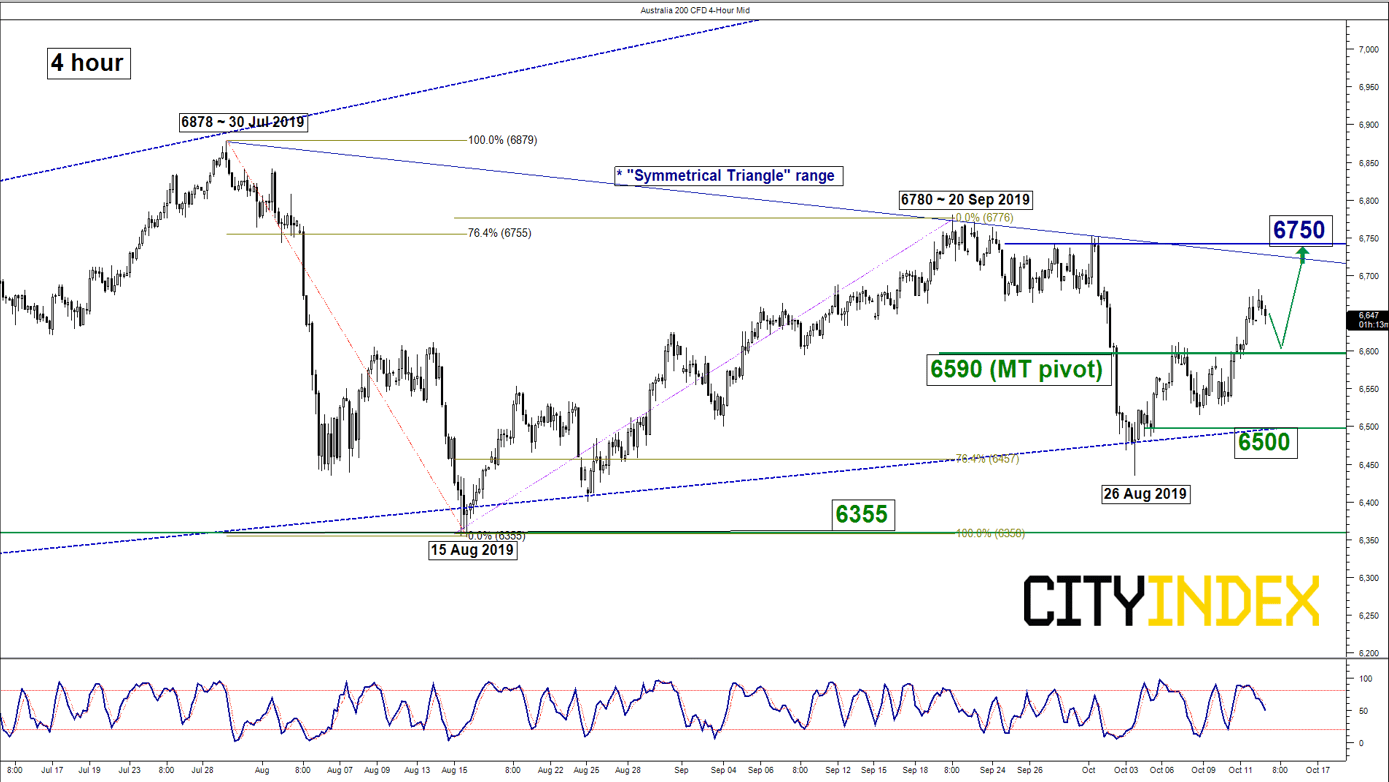
Pivot (key support): 6590
Resistance: 6750
Next support: 6355
Directional Bias (1 to 3 weeks)
The Australia 200 Index (proxy for the ASX 200 futures) has staged the expected mean reversion rebound and surpassed the first target/resistance of 6605 as per highlighted in our previous report.
No change in key elements; maintain bullish bias in any dips (the 4-hour Stochastic oscillator has inched down from its overbought region) above the tightened 6590 key medium-term pivotal support for a further potential push up to target the next resistance at 6750 (upper boundary of a “Symmetrical Triangle” range resistance from 30 Jul 2019 high & 0.764 Fibonacci expansion of the rebound from 15 Aug low to 20 Sep 2019 high projected from 24 Aug 2019 low). On the other hand, a break below 5680 sees a slide retest the “Symmetrical Triangle” range support at 6500 and also the “Expanding Wedge” support in place since 27 Mar 2019 low
DAX – Further potential push up towards “Expanding Wedge” resistance
click to enlarge charts
Key Levels (1 to 3 weeks)
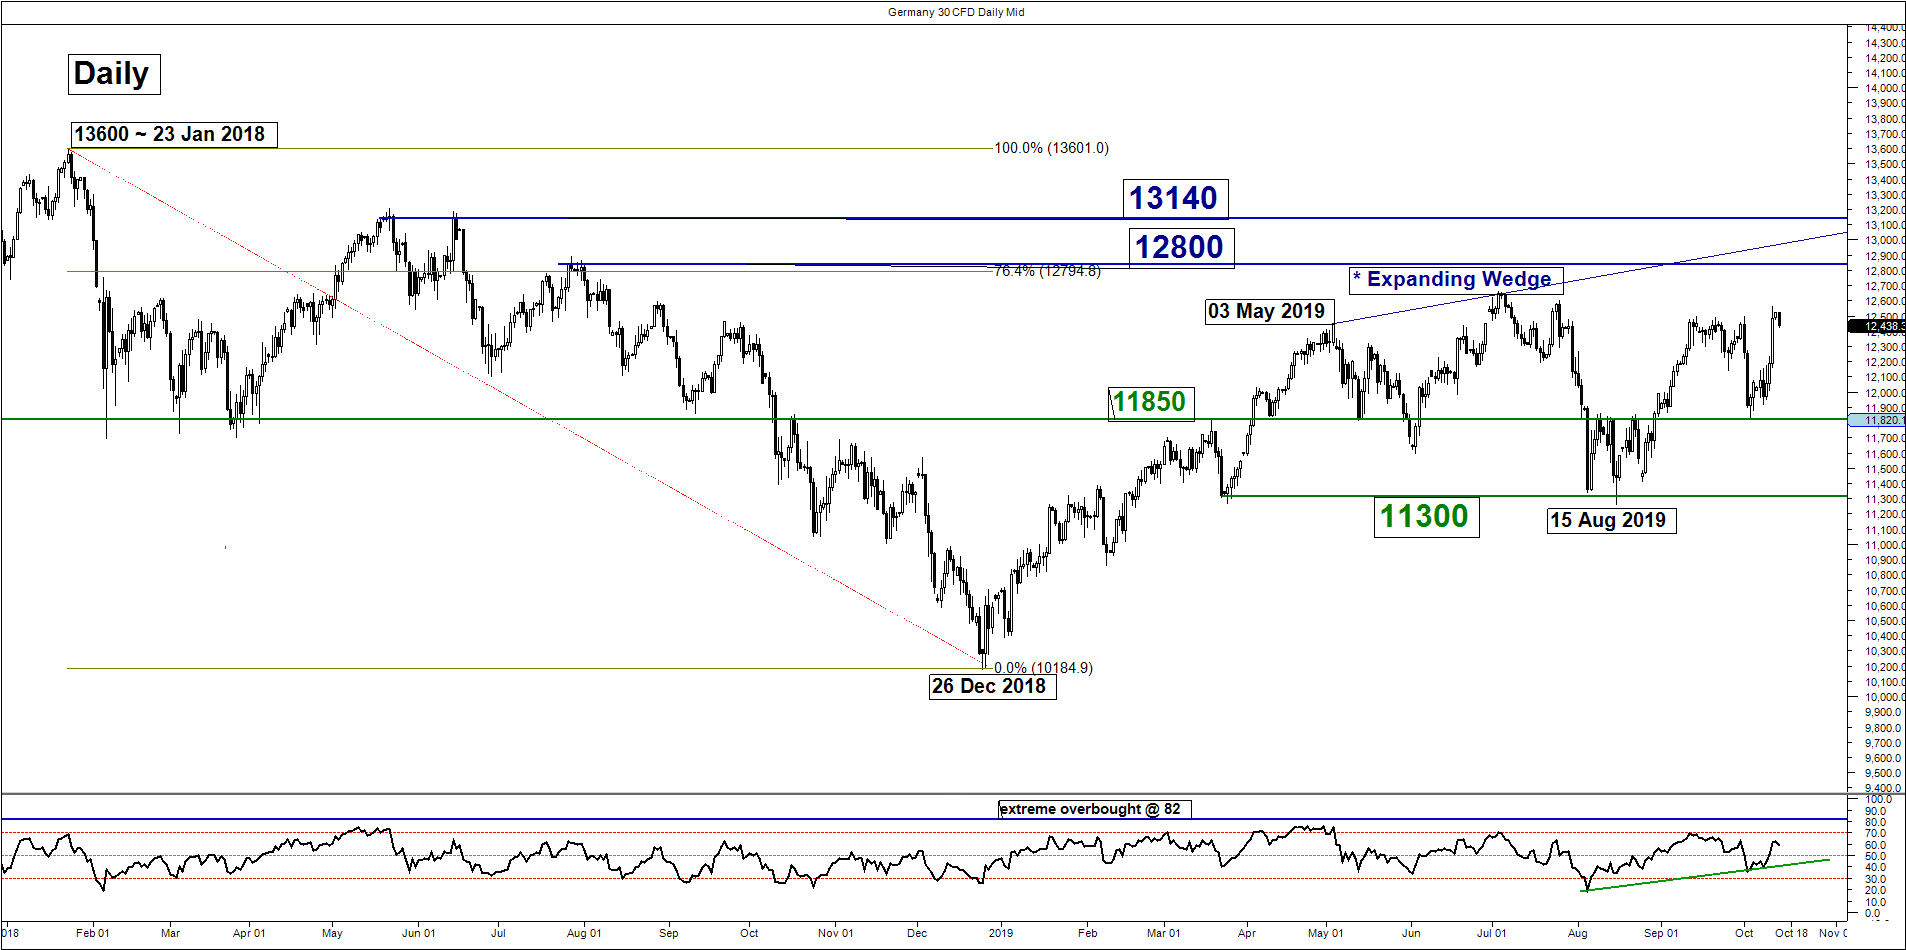
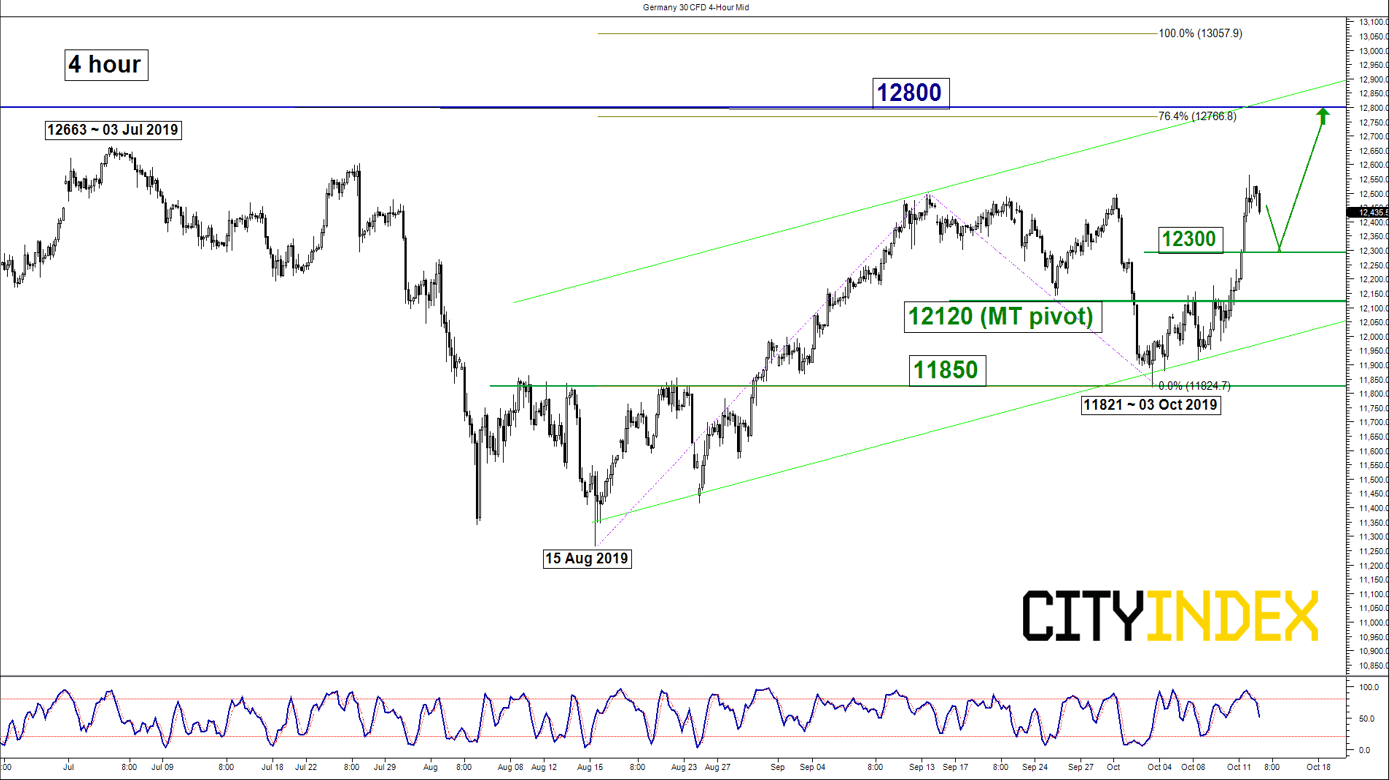
Intermediate support: 12300
Pivot (key support): 12120
Resistances: 12800
Next support: 11850
Directional Bias (1 to 3 weeks)
The Germany 30 Index (proxy for the DAX futures) has broken above the 12170 upper limit of the neutrality range zone which has validated the bullish scenario within “Expanding Wedge” rang configuration in place since 03 May 2019 high.
Flip to a bullish bias in an dips (4-hour Stochastic oscillator has inched down from overbought zone) towards the 12300 intermediate support (38.2% Fibonacci retracement of the last Fri’s steep rally from 08 Oct low to 12 Oct 2019 high of 12563) with 12120 as the key medium-term pivotal support for a further potential push up to target the next resistance at 12800 (upper boundary of the minor ascending channel from 15 Aug 2019 low & a Fibonacci retracement/expansion cluster).
On the other hand, a daily close below 12120 negates the bullish tone for a slide back to retest 11850 (congestion zone from 06 Feb 2018).
Charts are from City Index Advantage TraderPro & eSignal
From time to time, StoneX Financial Pty Ltd (“we”, “our”) website may contain links to other sites and/or resources provided by third parties. These links and/or resources are provided for your information only and we have no control over the contents of those materials, and in no way endorse their content. Any analysis, opinion, commentary or research-based material on our website is for information and educational purposes only and is not, in any circumstances, intended to be an offer, recommendation or solicitation to buy or sell. You should always seek independent advice as to your suitability to speculate in any related markets and your ability to assume the associated risks, if you are at all unsure. No representation or warranty is made, express or implied, that the materials on our website are complete or accurate. We are not under any obligation to update any such material.
As such, we (and/or our associated companies) will not be responsible or liable for any loss or damage incurred by you or any third party arising out of, or in connection with, any use of the information on our website (other than with regards to any duty or liability that we are unable to limit or exclude by law or under the applicable regulatory system) and any such liability is hereby expressly disclaimed.
City Index is a trading name of StoneX Financial Pty Ltd.
The material provided herein is general in nature and does not take into account your objectives, financial situation or needs.
While every care has been taken in preparing this material, we do not provide any representation or warranty (express or implied) with respect to its completeness or accuracy. This is not an invitation or an offer to invest nor is it a recommendation to buy or sell investments.
StoneX recommends you to seek independent financial and legal advice before making any financial investment decision. Trading CFDs and FX on margin carries a higher level of risk, and may not be suitable for all investors. The possibility exists that you could lose more than your initial investment further CFD investors do not own or have any rights to the underlying assets.
It is important you consider our Financial Services Guide and Product Disclosure Statement (PDS) available at www.cityindex.com/en-au/terms-and-policies/, before deciding to acquire or hold our products. As a part of our market risk management, we may take the opposite side of your trade. Our Target Market Determination (TMD) is also available at www.cityindex.com/en-au/terms-and-policies/.
StoneX Financial Pty Ltd, Suite 28.01, 264 George Street, Sydney, NSW 2000 (ACN 141 774 727, AFSL 345646) is the CFD issuer and our products are traded off exchange.
© City Index 2024