SP500 what comes next
A continued recovery in U.S. equity markets overnight prompted by headlines that a research team at a Chinese university had found an effective drug to treat patients of coronavirus and another round of better than expected U.S. economic data.
In terms of the U.S. economic data, the ADP employment print was notable for being the strongest number since May 2015 and was followed by better than expected ISM non-manufacturing PMI data coming hot on the heels of stronger than expected ISM manufacturing number released earlier in the week.
In our articles on key stock indices over the course of the past two weeks, our base case has been for a pullback of between 3-5% in key equity markets including the S&P 500 and the ASX200, the emergence of the virus being the catalyst for the corrections.
The strong rebound in both the S&P500 and the ASX 200 comes following falls of -3.7% and -3.5% respectively, right in the ballpark of what we looking for, a pleasing development as an analyst and a trader, a tragedy that it comes as a result of the loss of human life.
Taking into careful consideration that uncertainties remain around the duration and severity of the coronavirus, we will attempt to answer what comes next for the benchmark S&P 500 equity index, the barometer of risk sentiment that I most rely on.
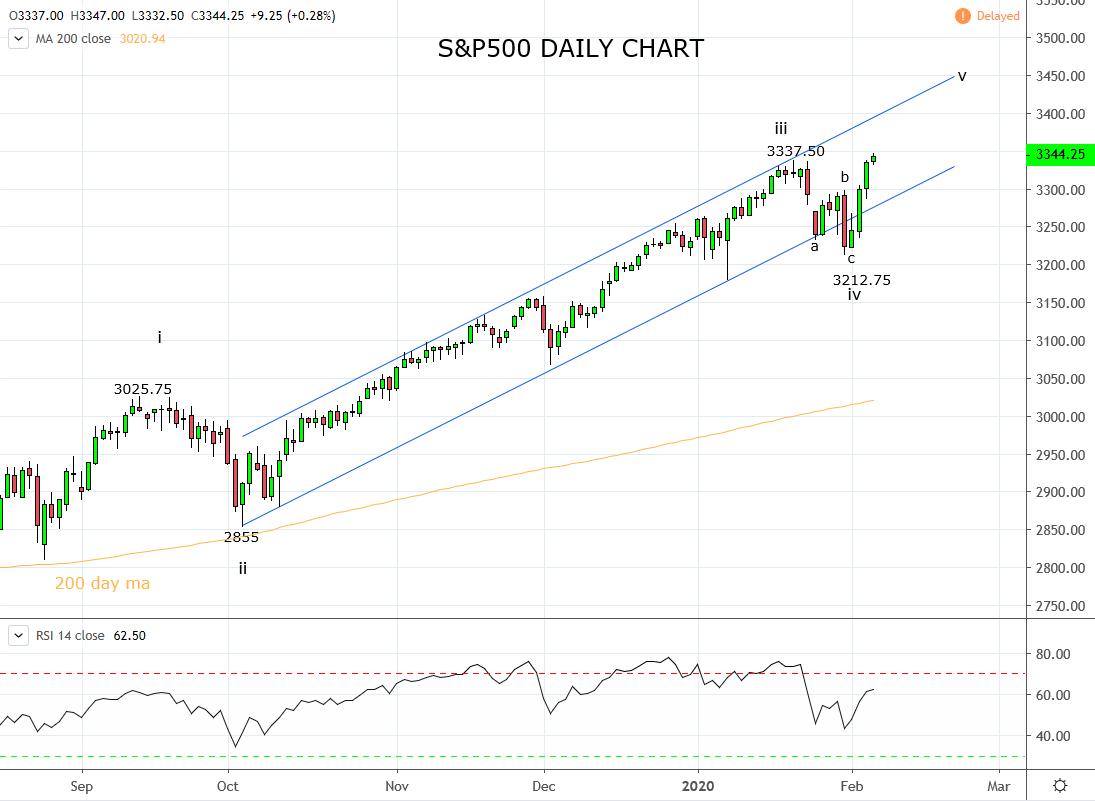
As viewed on the chart below, the decline from the 3337.50 high to this week’s 3212.75 low, while falling just short of our ideal pullback target between 3200 and 3180 unfolded in three waves, typically a sign of a correction, before returning to the surety of a well establish uptrend channel.
Today in the Asian session, S&P 500 futures have made new all-time highs, in theory, the minimum requirement for a Wave v. However, if we use a common projection for a Wave v which is the length of Wave i, there is scope for the next leg higher to extend towards 3450/3500.
In a nutshell, the recent correction appears complete and the 3450/3500 area becomes the next upside target, using this week's 3212.75 swing low as the bullish reassessment level.
Source Tradingview. The figures stated areas of the 6th of February 2020. Past performance is not a reliable indicator of future performance. This report does not contain and is not to be taken as containing any financial product advice or financial product recommendation
From time to time, StoneX Financial Pty Ltd (“we”, “our”) website may contain links to other sites and/or resources provided by third parties. These links and/or resources are provided for your information only and we have no control over the contents of those materials, and in no way endorse their content. Any analysis, opinion, commentary or research-based material on our website is for information and educational purposes only and is not, in any circumstances, intended to be an offer, recommendation or solicitation to buy or sell. You should always seek independent advice as to your suitability to speculate in any related markets and your ability to assume the associated risks, if you are at all unsure. No representation or warranty is made, express or implied, that the materials on our website are complete or accurate. We are not under any obligation to update any such material.
As such, we (and/or our associated companies) will not be responsible or liable for any loss or damage incurred by you or any third party arising out of, or in connection with, any use of the information on our website (other than with regards to any duty or liability that we are unable to limit or exclude by law or under the applicable regulatory system) and any such liability is hereby expressly disclaimed.
City Index is a trading name of StoneX Financial Pty Ltd.
The material provided herein is general in nature and does not take into account your objectives, financial situation or needs.
While every care has been taken in preparing this material, we do not provide any representation or warranty (express or implied) with respect to its completeness or accuracy. This is not an invitation or an offer to invest nor is it a recommendation to buy or sell investments.
StoneX recommends you to seek independent financial and legal advice before making any financial investment decision. Trading CFDs and FX on margin carries a higher level of risk, and may not be suitable for all investors. The possibility exists that you could lose more than your initial investment further CFD investors do not own or have any rights to the underlying assets.
It is important you consider our Financial Services Guide and Product Disclosure Statement (PDS) available at www.cityindex.com/en-au/terms-and-policies/, before deciding to acquire or hold our products. As a part of our market risk management, we may take the opposite side of your trade. Our Target Market Determination (TMD) is also available at www.cityindex.com/en-au/terms-and-policies/.
StoneX Financial Pty Ltd, Suite 28.01, 264 George Street, Sydney, NSW 2000 (ACN 141 774 727, AFSL 345646) is the CFD issuer and our products are traded off exchange.
© City Index 2024