SP500 Long Buybacks And Value
Whilst the S&P500 bullish trend rages on, there are near-term signs of exhaustion. Yet looking at the leaders and the laggards, it also appears that the driving forces behind these new highs has changed.
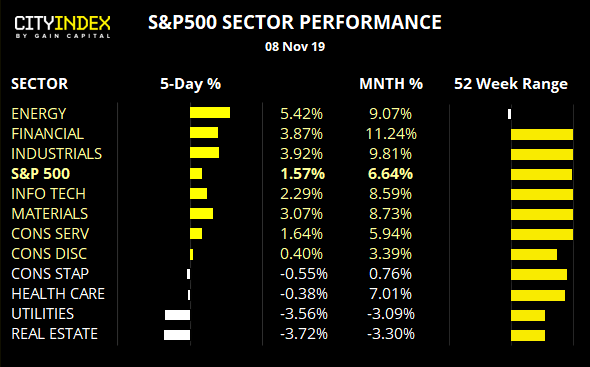
It’s been a good week for energy stocks, with trade optimism and higher oil prices obviously helping. If the deal can go through and commodity prices rise, energy stocks appear quite attractive at their relatively cheap lows. And this shift in trade sentiment has also seen top performers of late reverse course, as real estate, utilities and healthcare have dipped. So, trade talks remain a clear driver of sentiment, and e can’t help but wonder if the December “phase one” signing has actually been aligned with good old Santa’s rally. Time will tell no doubt tell.
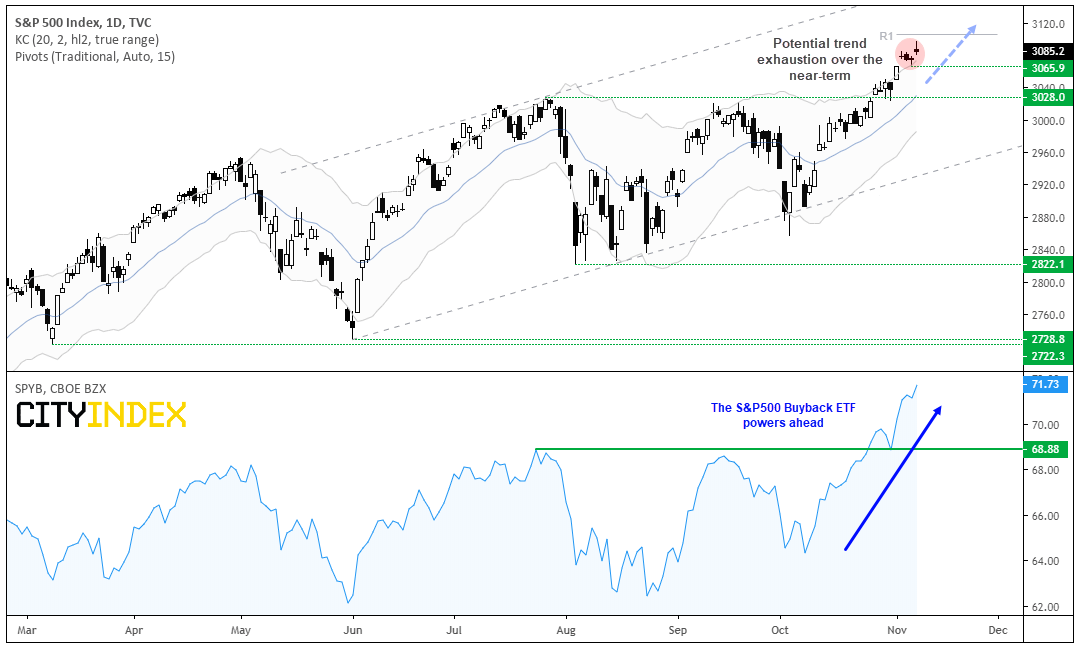
S&P500: The trend is undeniably strong and the break to new highs reaffirms the bullish channel from the June low. And we can also see that buybacks remain a key driver for the S&P500 as the buyback index ETF (lower panel) has broken to new highs in tandem with the S&P’s breakout.
That said, a series of indecision candles above the upper keltner band warns of potential trend exhaustion over the near-term which leaves the potential for a pause in trend or correction. And these candles have formed just beneath the monthly R1 pivot. It’s also worth noting that a bearish pinbar formed, despite the positive news that the US will roll back tariffs as part of a deal.
- Bulls could look for prices to consolidate/retrace towards 3065.9 before seeking new longs.
- If prices break below 3065.9 then a deeper correction is on the cards, although bulls could be eager to buy any dips above 3028 support given the significance of the level.
- If bearish momentum takes prices notably lower, then bulls would be prudent to step aside until the dust settles. Moreover, if we see the yen and gold catch a bid again, then perhaps something larger is going down (whether economically, or yet another reversal of sentient with trade talks).
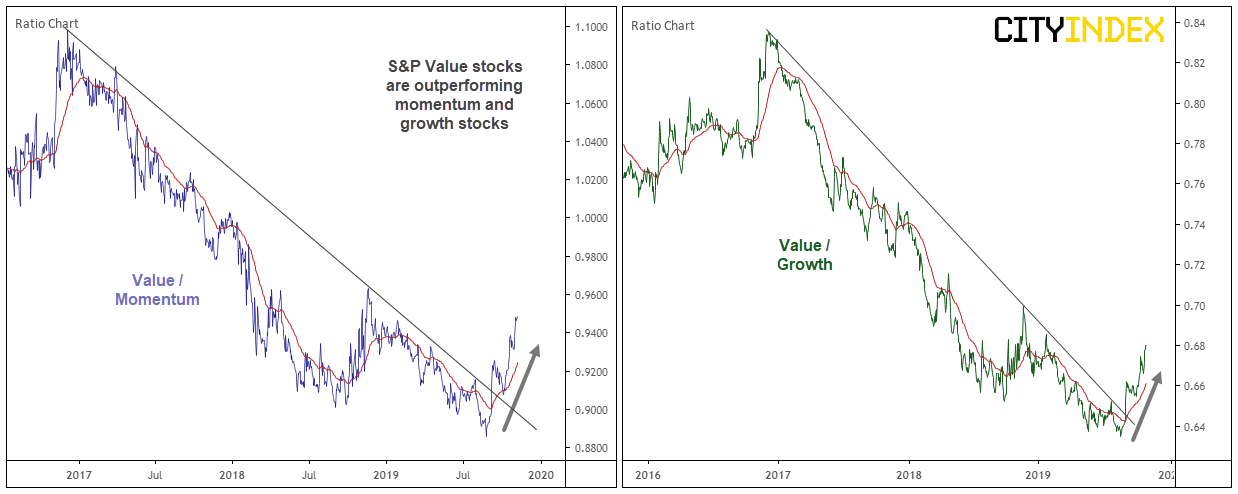
To finish up on a different angle, I can’t help but notice that value stocks are coming back into fashion whilst the S&P500 breaks to new highs. Value stocks are considered below fundamental value (therefore ‘cheap’ by some metrics) and have mostly underperformed the S&P500 since the 2009 low. Moreover, value stocks are outperforming both momentum and growth stocks. This could be quite telling regarding the relative value of the S&P500, as growth stocks revenues are expected to outperform relative to the average company (therefor higher prices) and momentum stocks are those which generally lead the index higher. So if momentum stocks are lagging and growth stocks are now not expected to grow relative to the average, what does this say about the underlying health of this bull market? Whilst this could take some time to play out, the dynamic has certainly changed and is worth keeping track of as this bull market develops.
Related analysis:
S&P500: The Long & Short Of It | SPX, SYS, ORLY, EBAY, TXN
Trade Deal Optimism From China Triggers Euphoric Mood - An Update On SPX, NDX & Hang Seng
From time to time, StoneX Financial Pty Ltd (“we”, “our”) website may contain links to other sites and/or resources provided by third parties. These links and/or resources are provided for your information only and we have no control over the contents of those materials, and in no way endorse their content. Any analysis, opinion, commentary or research-based material on our website is for information and educational purposes only and is not, in any circumstances, intended to be an offer, recommendation or solicitation to buy or sell. You should always seek independent advice as to your suitability to speculate in any related markets and your ability to assume the associated risks, if you are at all unsure. No representation or warranty is made, express or implied, that the materials on our website are complete or accurate. We are not under any obligation to update any such material.
As such, we (and/or our associated companies) will not be responsible or liable for any loss or damage incurred by you or any third party arising out of, or in connection with, any use of the information on our website (other than with regards to any duty or liability that we are unable to limit or exclude by law or under the applicable regulatory system) and any such liability is hereby expressly disclaimed.
City Index is a trading name of StoneX Financial Pty Ltd.
The material provided herein is general in nature and does not take into account your objectives, financial situation or needs.
While every care has been taken in preparing this material, we do not provide any representation or warranty (express or implied) with respect to its completeness or accuracy. This is not an invitation or an offer to invest nor is it a recommendation to buy or sell investments.
StoneX recommends you to seek independent financial and legal advice before making any financial investment decision. Trading CFDs and FX on margin carries a higher level of risk, and may not be suitable for all investors. The possibility exists that you could lose more than your initial investment further CFD investors do not own or have any rights to the underlying assets.
It is important you consider our Financial Services Guide and Product Disclosure Statement (PDS) available at www.cityindex.com/en-au/terms-and-policies/, before deciding to acquire or hold our products. As a part of our market risk management, we may take the opposite side of your trade. Our Target Market Determination (TMD) is also available at www.cityindex.com/en-au/terms-and-policies/.
StoneX Financial Pty Ltd, Suite 28.01, 264 George Street, Sydney, NSW 2000 (ACN 141 774 727, AFSL 345646) is the CFD issuer and our products are traded off exchange.
© City Index 2024