SP500 Long And Short Of It KSU FBHS CRM DLTR
- The S&P500 made a fresh all-time high on an intraday basis, yet closed back beneath the 3258.10 high. It’s not quite a bearish hammer, but it does show a hesitancy to break higher for now. Still, E-mini futures posted an elongated, bullish hammer and Asia prices are sniffing at the record highs. With Middle East tensions on the back burner (for now) and the potential for a phase one trade deal on Wednesday, we favour the index to break to new highs. However, if it’s to break beneath 3200 then a correction is underway.
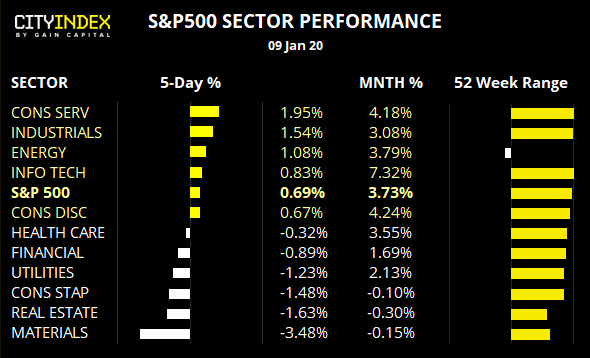
- Info-tech, consumer services and industrials have been the strongest performers over the past 52-weeks. Yet measured from the December 2018 low, the clear winner is the real estate sector having racked up +17.3%. In fact, over this period the only other sector to gain is the communications sector at +2.9%.
- The energy sector remains effectively rangebound, much like crude oil after its failure to break out of its 9-month high. It’s also the only sector to trade lower over the past 52-weeks, and trail other sectors performance by a long shot.
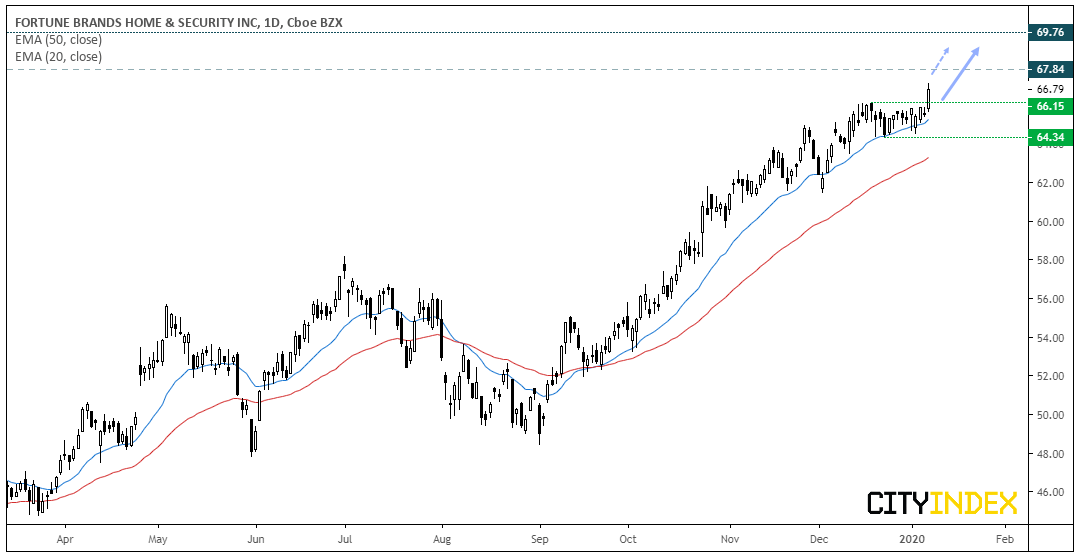
Fortune Brand Home & Security (FBHS): A breakout to new highs has been supported by a strong trend structure, following a period of consolidation at the highs. Furthermore, the breakout was seen in higher than average volume but. The trend remains bullish above 66.34 but traders could seek bullish setups above 66.15.
- Bulls could seek dips above 64.34. Although a direct break above yesterday’s high could entice momentum traders, who could use 66.15 to aid with risk management.
- In Feb 2018 a gap occurred between 67.84 – 69.76 but, given the strength of the trend, we’re targeting the upside of the gap at 69.76.
- A break below 64.34 invalidates the bullish bias over the near-term
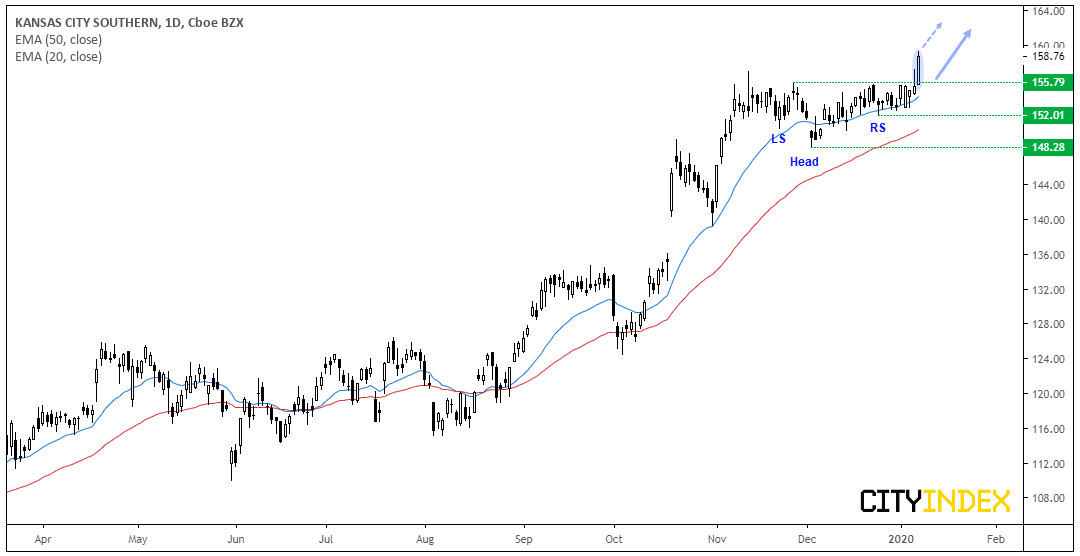
Kansas City Southern (KSU): After consolidating for over two months around record highs, we finally saw a bullish breakout on a strong close to fresh highs. It also appears to have confirmed an inverted head and shoulders pattern, which is a continuation pattern in an uptrend. Moreover, the breakout was on high volume to show strength coming into the move. Whilst the daily trend remains bullish above the 148.28 wing low, momentum traders could look for closer areas of support to aid with risk management.
- A break above yesterday’s high assumes direct gains, and the 155.79 resistance level can be used to aid risk management.
- If prices consolidate, bulls could use the 152 swing low to maintain their bullish bias (as a break below it invalidates the setup).
- Bulls could use an open target with it being at record highs.
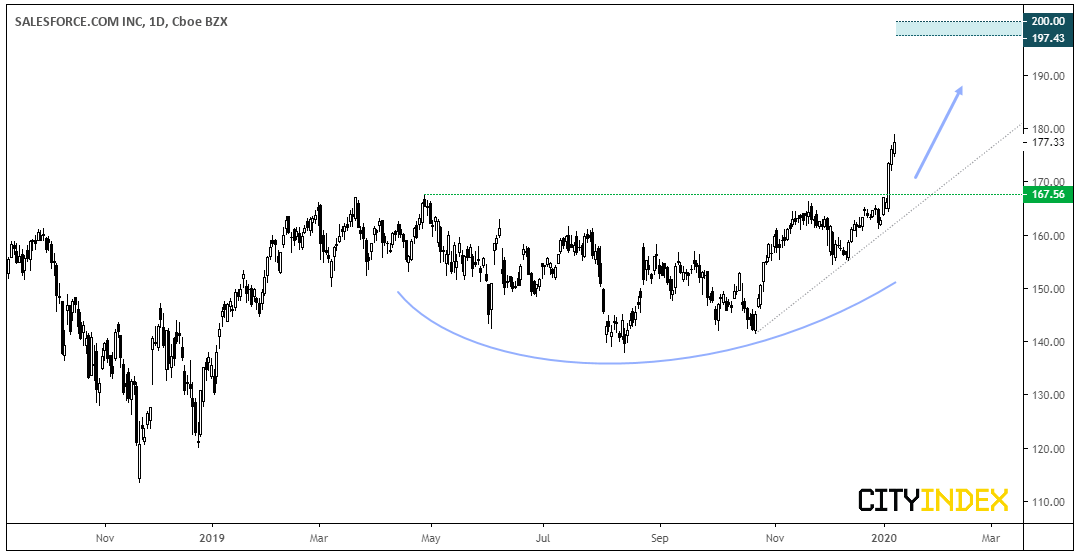
Salesforce.com (CRM): Monday saw a breakout from an 8-month basing pattern on high volume. If The pattern projects a target just below 20, if successful. Ultimately, we remain bullish above the 167.56 breakout level, but we’d prefer to see a pullback towards this key level or a period of consolidation.
- Bulls could wait for a retracement and to see if either the 167.56 breakout level or bullish trendline holds as support.
- Alternatively, if prices consolidate for several days and provide a shallow back, momentum traders could seek a break of the highs.
- Bias remains bullish above 167.56
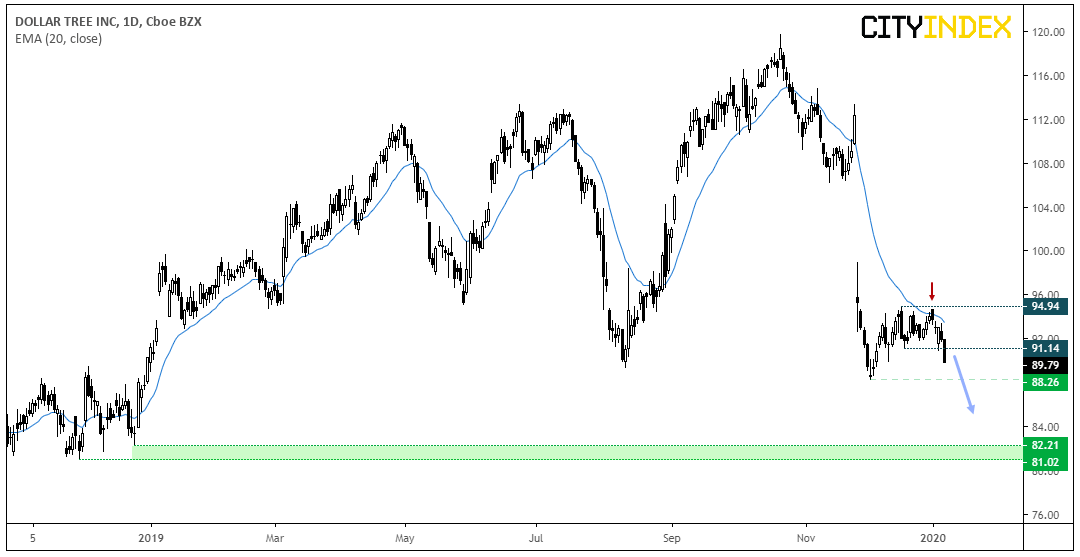
Dollar Tree (DLTR): The dead cat has bounced and is now rolling over once more. Following a 13% gap lower in late November, it spent best part of December trying (but ultimately failing) to lift itself from the lows. Bearish momentum has clearly returned and the correction appears to have ended at 94.94.
- Bias remains bearish below 94.94. although bears could also use 91.14 resistance to aid with risk management (or fade into).
- Due to the strength of the bearish trend, we anticipate a downside break of 88.26
- Bears could target the lows around 81-82.
From time to time, StoneX Financial Pty Ltd (“we”, “our”) website may contain links to other sites and/or resources provided by third parties. These links and/or resources are provided for your information only and we have no control over the contents of those materials, and in no way endorse their content. Any analysis, opinion, commentary or research-based material on our website is for information and educational purposes only and is not, in any circumstances, intended to be an offer, recommendation or solicitation to buy or sell. You should always seek independent advice as to your suitability to speculate in any related markets and your ability to assume the associated risks, if you are at all unsure. No representation or warranty is made, express or implied, that the materials on our website are complete or accurate. We are not under any obligation to update any such material.
As such, we (and/or our associated companies) will not be responsible or liable for any loss or damage incurred by you or any third party arising out of, or in connection with, any use of the information on our website (other than with regards to any duty or liability that we are unable to limit or exclude by law or under the applicable regulatory system) and any such liability is hereby expressly disclaimed.
City Index is a trading name of StoneX Financial Pty Ltd.
The material provided herein is general in nature and does not take into account your objectives, financial situation or needs.
While every care has been taken in preparing this material, we do not provide any representation or warranty (express or implied) with respect to its completeness or accuracy. This is not an invitation or an offer to invest nor is it a recommendation to buy or sell investments.
StoneX recommends you to seek independent financial and legal advice before making any financial investment decision. Trading CFDs and FX on margin carries a higher level of risk, and may not be suitable for all investors. The possibility exists that you could lose more than your initial investment further CFD investors do not own or have any rights to the underlying assets.
It is important you consider our Financial Services Guide and Product Disclosure Statement (PDS) available at www.cityindex.com/en-au/terms-and-policies/, before deciding to acquire or hold our products. As a part of our market risk management, we may take the opposite side of your trade. Our Target Market Determination (TMD) is also available at www.cityindex.com/en-au/terms-and-policies/.
StoneX Financial Pty Ltd, Suite 28.01, 264 George Street, Sydney, NSW 2000 (ACN 141 774 727, AFSL 345646) is the CFD issuer and our products are traded off exchange.
© City Index 2024