silver precious metals soar as yields plunge 2668742016
Precious metals have lived up to expectations at these times of high uncertainty. Gold has managed to hold onto most of the Brexit-related gains made at the end of last week, while silver has actually made significantly more. Unlike the former, the latter has also many industrial uses and so when base metal like copper rally, silver benefits from this source, too. It is therefore also less sensitive to the “risk-on, risk-off” trade that the safe-haven gold sometimes suffers from when equities and other commodities are in demand. Both metals have also found support from the falling government bond yields to repeated all-time lows and for now at least are able to withstand the dollar’s renewed strength. Today, the US 10-year Treasury yield was the latest to hit a record low, breaking the previous low hit in July 2012. In the UK, the 10-year gilt yield fell further to 0.81% after yielding some 1.35% before last week’s EU referendum. And according to the FT, Switzerland’s entire stock of government debt is now yielding a negative return, even one that does not mature for almost 50 years!
You get the picture: yields are universally really low and in some cases negative. Yield-seeking investors are thus forced to move their funds into higher-yielding assets like equities and in some case properties. But so low are the yields that they even make non-interest bearing assets like gold and silver look relatively more appealing than fixed income. Of course, the metals have their own advantages, too, and fulfil different needs, but here I am not talking about those aspects or capital appreciation.
Anyway, the US dollar – and therefore buck-denominated precious metals – will be in focus again next week as the attention turns away from Brexit slightly and more towards economic fundamentals and US monetary policy. Given the behaviour of the bond and equity markets, as well as uncertainty about the economic impact of Brexit, not many people are expecting the US Federal Reserve to raise interest rates in the coming months. But if we a surprisingly strong jobs report and favourable revisions for the June nonfarm payrolls data then this could give the dollar a boost nonetheless, especially against currencies where the central bank is or turning dovish, such as GBP. It could also undermine gold and silver, at least temporarily. Apart from a potential rally for the US dollar, one other risk facing precious metals is profit-taking given their sharp recent gains and strong inflows into ETFs of late. Conversely, a weaker jobs report will once and for all put to bed talks of a rate increase in 2016. This potential scenario should be good news for precious metals.
Technical outlook: silver clears major resistance
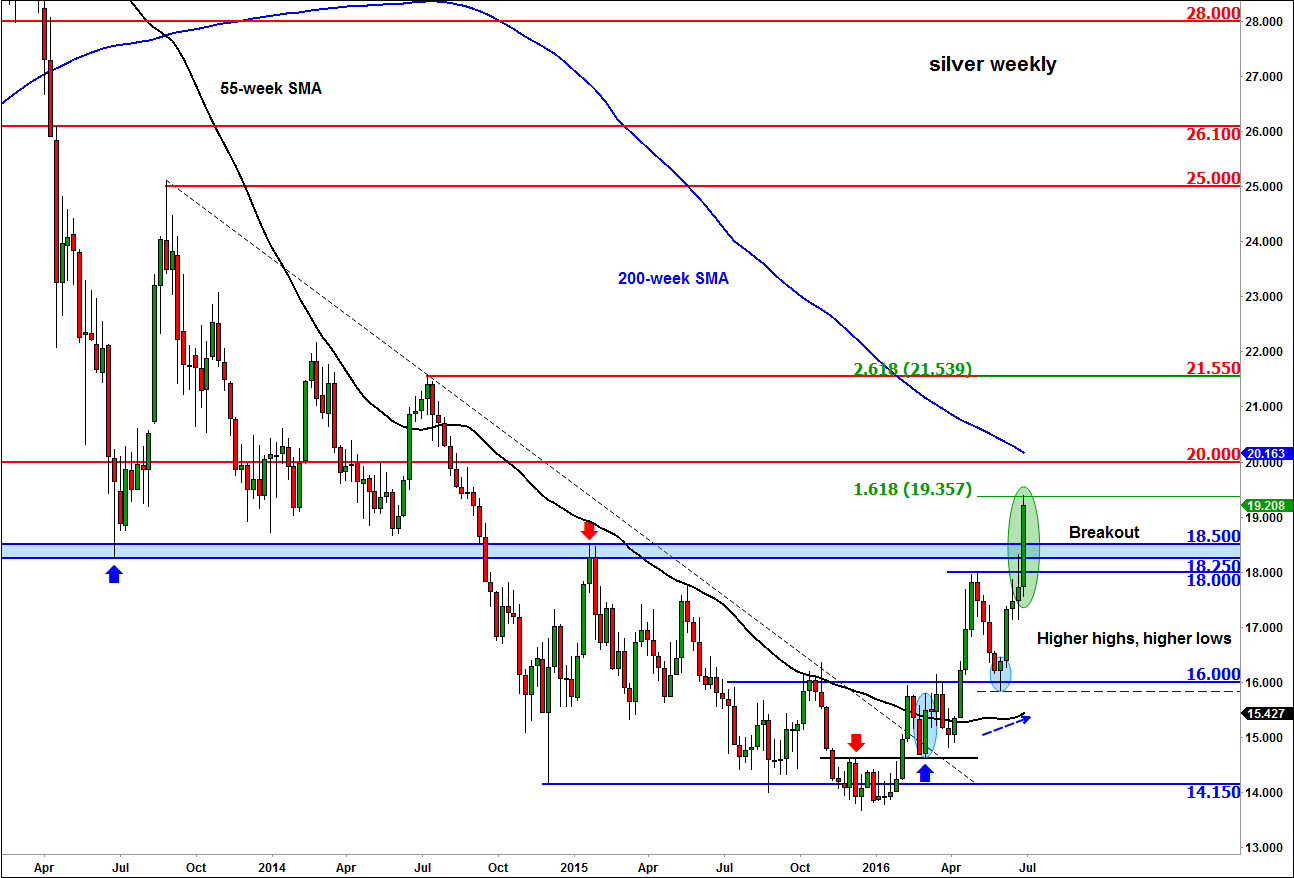
From a technical point of view, the weekly chart of silver shows that the metal has been making a series of higher highs and higher lows ever since it took out the long-term bearish trend line at the start of this year. As a result of the rally, the 55-week moving average has turned higher, objectively telling us that the medium term trend is indeed bullish. But the slower 200-week SMA is yet to respond, which is hardly surprising. This week, silver has staged a clean breakout above the prior resistance zone in the $18.25-$18.50 range.
This should, in theory anyway, pave the way for further momentum buying pressure. But perhaps not before a pause or a hiccup, which should allow the short-term oscillators to unwind from “overbought” or levels. In fact, silver may well have completed the fifth of the Elliott waves. In addition, it has reached the 161.8% Fibonacci extension level of its prior corrective wave, at $19.35. This marks an exhaustion area for price where some traders take profit around.
Therefore, bullish speculators may wish to wait for a pullback of some sort before pulling the trigger. Ideally, a re-test of the old resistance area in the $18.25 to $18.50, and a reversal candle on daily chart (or even the 1 hour time frame with RSI near 30) could be what is needed before we see another leg higher.
Some potential resistance levels to watch include the psychologically-important $20 handle, the 200-week SMA at $20.15 and the July 2014 high at around $21.55. But given this year’s technical (and fundamental) developments, the long-term direction may have turned higher and so we could see some significant gains going forward. That being said, a potential break below the prior high of $18.00 would invalidate this bullish setup.
From time to time, StoneX Financial Pty Ltd (“we”, “our”) website may contain links to other sites and/or resources provided by third parties. These links and/or resources are provided for your information only and we have no control over the contents of those materials, and in no way endorse their content. Any analysis, opinion, commentary or research-based material on our website is for information and educational purposes only and is not, in any circumstances, intended to be an offer, recommendation or solicitation to buy or sell. You should always seek independent advice as to your suitability to speculate in any related markets and your ability to assume the associated risks, if you are at all unsure. No representation or warranty is made, express or implied, that the materials on our website are complete or accurate. We are not under any obligation to update any such material.
As such, we (and/or our associated companies) will not be responsible or liable for any loss or damage incurred by you or any third party arising out of, or in connection with, any use of the information on our website (other than with regards to any duty or liability that we are unable to limit or exclude by law or under the applicable regulatory system) and any such liability is hereby expressly disclaimed.
City Index is a trading name of StoneX Financial Pty Ltd.
The material provided herein is general in nature and does not take into account your objectives, financial situation or needs.
While every care has been taken in preparing this material, we do not provide any representation or warranty (express or implied) with respect to its completeness or accuracy. This is not an invitation or an offer to invest nor is it a recommendation to buy or sell investments.
StoneX recommends you to seek independent financial and legal advice before making any financial investment decision. Trading CFDs and FX on margin carries a higher level of risk, and may not be suitable for all investors. The possibility exists that you could lose more than your initial investment further CFD investors do not own or have any rights to the underlying assets.
It is important you consider our Financial Services Guide and Product Disclosure Statement (PDS) available at www.cityindex.com/en-au/terms-and-policies/, before deciding to acquire or hold our products. As a part of our market risk management, we may take the opposite side of your trade. Our Target Market Determination (TMD) is also available at www.cityindex.com/en-au/terms-and-policies/.
StoneX Financial Pty Ltd, Suite 28.01, 264 George Street, Sydney, NSW 2000 (ACN 141 774 727, AFSL 345646) is the CFD issuer and our products are traded off exchange.
© City Index 2024