RBS tanks on torn up targets
It’s preparing for worst Brexit fears to be confirmed
Amongst Britain’s large banks, it was RBS that sounded the earliest and most strident warnings about the impact of Brexit on its business. The group faces a particularly challenging mix of state-ownership, regulated size, strategy and domestic market positioning that means it can take even fewer chances than its risk-averse rival Lloyds Banking Group. As such, not even a massively above consensus pay-out is being seen by investors as enough compensation for RBS adopting an even deeper defensive posture. It has abandoned 2020 goals, particularly those relating to the return on tangible equity, which determine improvements (or not) in the level of profits that could be available for investors in the form of dividends or buybacks.
From the H1 statement: “Given current market conditions, continued economic and political uncertainty and the contraction of the yield curve, it is very unlikely that we will achieve our target return on tangible equity of more than 12% and cost: income ratio of less than 50% in 2020.”
Making perceptions of the group’s performance so far this year worse, first-half and quarterly earnings are of questionable quality.
RBS’s second quarter operating income of £1.68bn beat an average analyst estimate compiled by the group of £1.32bn. Or, rather it did, if a £990m gain from the merger of Saudi Arabian banks SABB and Alawwal is included. RBS held a 40% stake in the latter via a Dutch subsidiary. Before the announcement in June, the gain wasn’t on the radar for many. With proceeds removed, the £690m underlying operating profit is a big miss.
Also, as the rates environment deteriorates, RBS’s net interest income and margins are deteriorating, in common with all large lenders, often more than feared.
- Q2 net interest income: £1.97bn; estimate: £2.16bn
- Q2 net interest margin: 1.78%; estimate: 1.985%
With the 50% cost: income target also dropped, the bank is giving itself maximum flexibility to deal with likely intensification of economic and monetary headwinds in coming months.
“The most important thing we can do as a bank is that we have the right liquidity” in the event of a no-deal Brexit, Katie Murray, the bank’s chief financial officer told Bloomberg TV. That’s prudent. It also seals the fate of RBS shares for the rest of the year, at least. They were already slightly underperforming those of its chief rival Lloyds over the year to date. That gap is now set to widen.
Chart thoughts
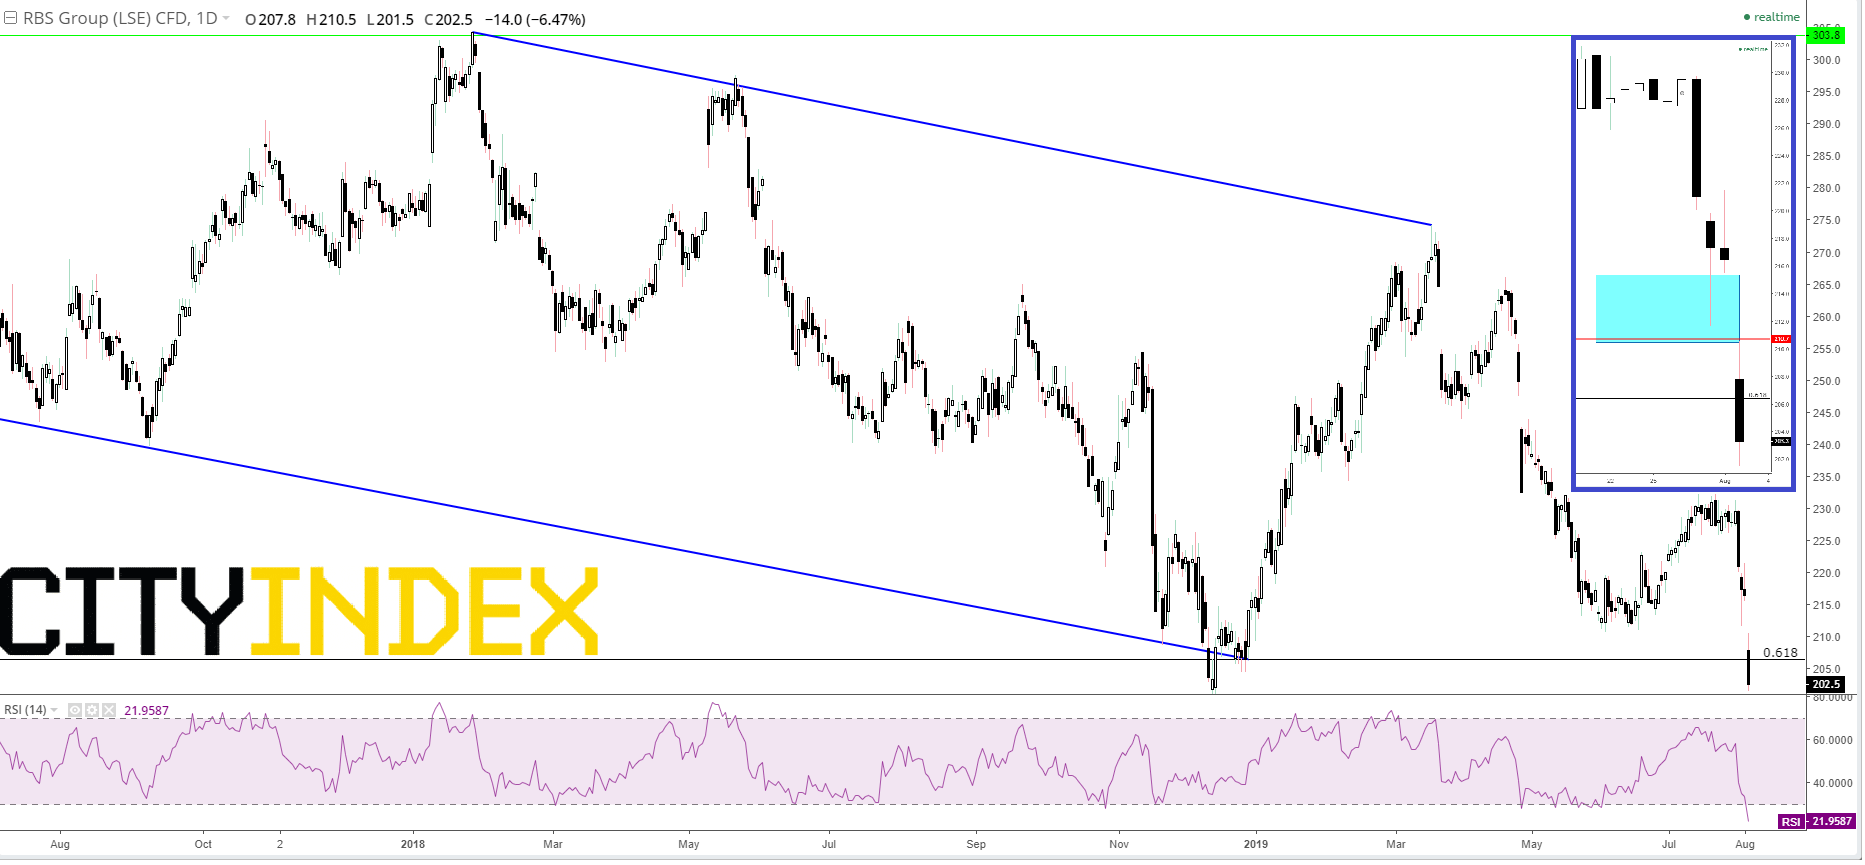
It’s critical to bear in mind the stock’s ‘lost decade’ following the financial crisis and subsequent bailout, during it which it has been stuck in a chronic range. As economic pessimism set in, following the 2016 referendum, that range has tightened even more. The swing off post-24th June 2016 lows just below 150p reversed in January 2018 some 150p higher. Since then, note the formation of a declining trend from late-April 2017 to end-December 2018 together with a rougher falling line from January last year to last March. Apart from flagging resumption of a ‘bear’, it stabilized the downtrend right back to the 61.8% retracement of the move higher beginning June 2018. Implied support there (206p) was violated first at the bottom of last winter’s correction. Friday’s crash through it thereby looks all the more emphatic. The inset reveals that a 5-penny gap remains between Thursday’s 215.5p low and Friday’s 210.5 high. The normal instinct to fill it is impeded by supportive consolidation lows in June that are now resistant; especially 4th June’s 210.7p. As such, the line of lesser resistance should be lower still, whilst RSI shoots deep into oversold territory. December’s bottom at almost 200p dead will be a tempting objective.
RBS GROUP CFD – daily
Source: City Index
From time to time, StoneX Financial Pty Ltd (“we”, “our”) website may contain links to other sites and/or resources provided by third parties. These links and/or resources are provided for your information only and we have no control over the contents of those materials, and in no way endorse their content. Any analysis, opinion, commentary or research-based material on our website is for information and educational purposes only and is not, in any circumstances, intended to be an offer, recommendation or solicitation to buy or sell. You should always seek independent advice as to your suitability to speculate in any related markets and your ability to assume the associated risks, if you are at all unsure. No representation or warranty is made, express or implied, that the materials on our website are complete or accurate. We are not under any obligation to update any such material.
As such, we (and/or our associated companies) will not be responsible or liable for any loss or damage incurred by you or any third party arising out of, or in connection with, any use of the information on our website (other than with regards to any duty or liability that we are unable to limit or exclude by law or under the applicable regulatory system) and any such liability is hereby expressly disclaimed.
City Index is a trading name of StoneX Financial Pty Ltd.
The material provided herein is general in nature and does not take into account your objectives, financial situation or needs.
While every care has been taken in preparing this material, we do not provide any representation or warranty (express or implied) with respect to its completeness or accuracy. This is not an invitation or an offer to invest nor is it a recommendation to buy or sell investments.
StoneX recommends you to seek independent financial and legal advice before making any financial investment decision. Trading CFDs and FX on margin carries a higher level of risk, and may not be suitable for all investors. The possibility exists that you could lose more than your initial investment further CFD investors do not own or have any rights to the underlying assets.
It is important you consider our Financial Services Guide and Product Disclosure Statement (PDS) available at www.cityindex.com/en-au/terms-and-policies/, before deciding to acquire or hold our products. As a part of our market risk management, we may take the opposite side of your trade. Our Target Market Determination (TMD) is also available at www.cityindex.com/en-au/terms-and-policies/.
StoneX Financial Pty Ltd, Suite 28.01, 264 George Street, Sydney, NSW 2000 (ACN 141 774 727, AFSL 345646) is the CFD issuer and our products are traded off exchange.
© City Index 2024