putin inspired crude oil rally boosts canadian dollar 2678162016
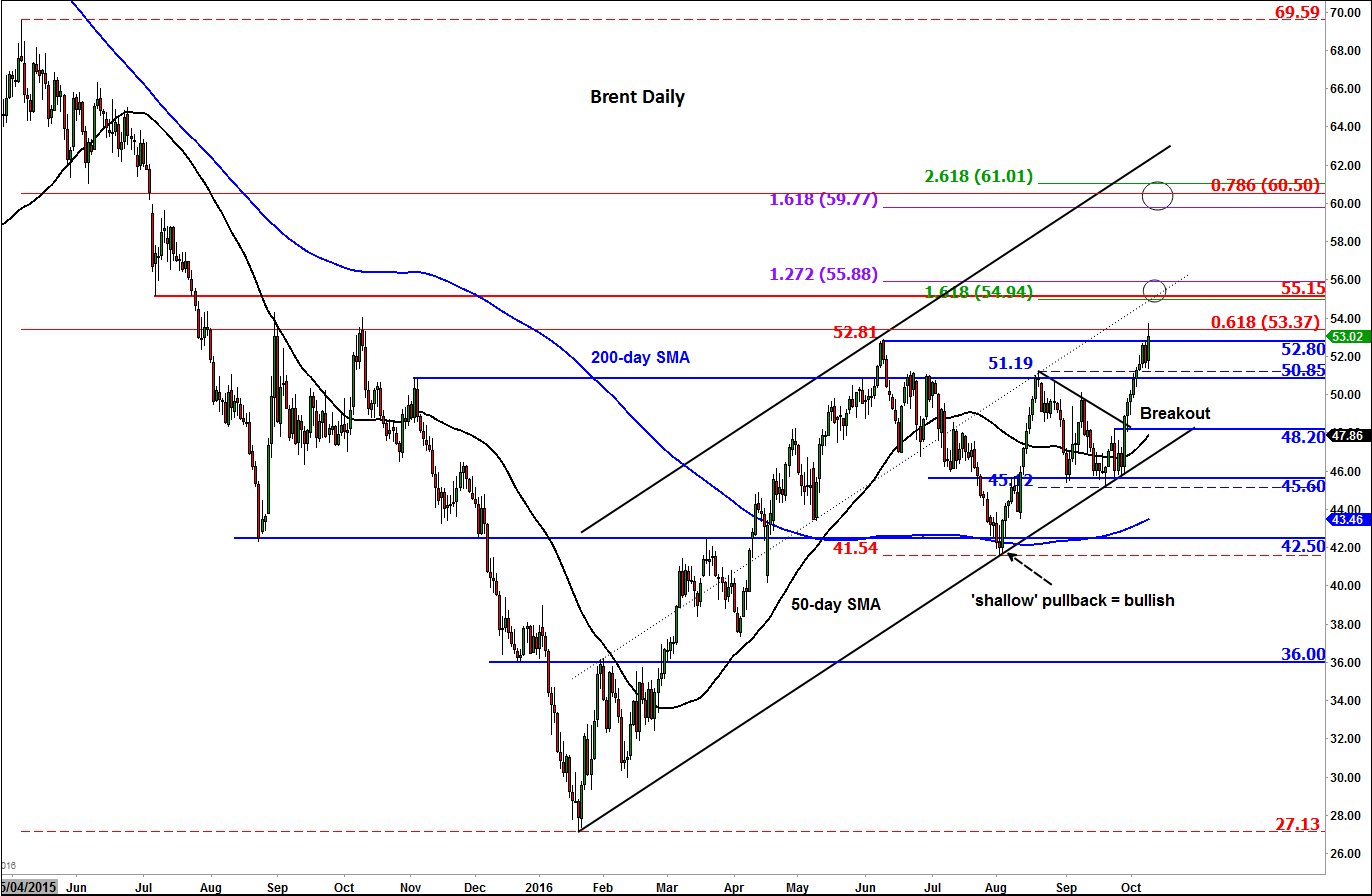
Crude oil prices surged higher in response to comments made by Russian President Vladimir Putin about a Russian-OPEC production cut. Brent oil reached a new 52-week high around $53.70 per barrel (see figure 1) while WTI came to within a few cents of the $51.65 level it had hit in June. As Canada is a major oil producing nation, the bullish response from the Canadian dollar was hardly surprising: the USD/CAD dropped below 1.32 again and other CAD crosses rose sharply too, especially against currencies where the central bank is still uber-dovish, such as the yen.
Putin’s comments have taken the market by a bit of a surprise. I think the OPEC and Russia have recognised that sentiment on the oil market is turning bullish and they want to keep that momentum going by committing to what the market is demanding: production cuts. Major oil producing nations like Russia know how punishing the markets can be, so they may well succumb to pressure and actually reduce supply this time around because failure to do so would be disastrous. They have talked the talk, now it is time to walk the walk if they are committed to keeping oil prices north of $50 a barrel.
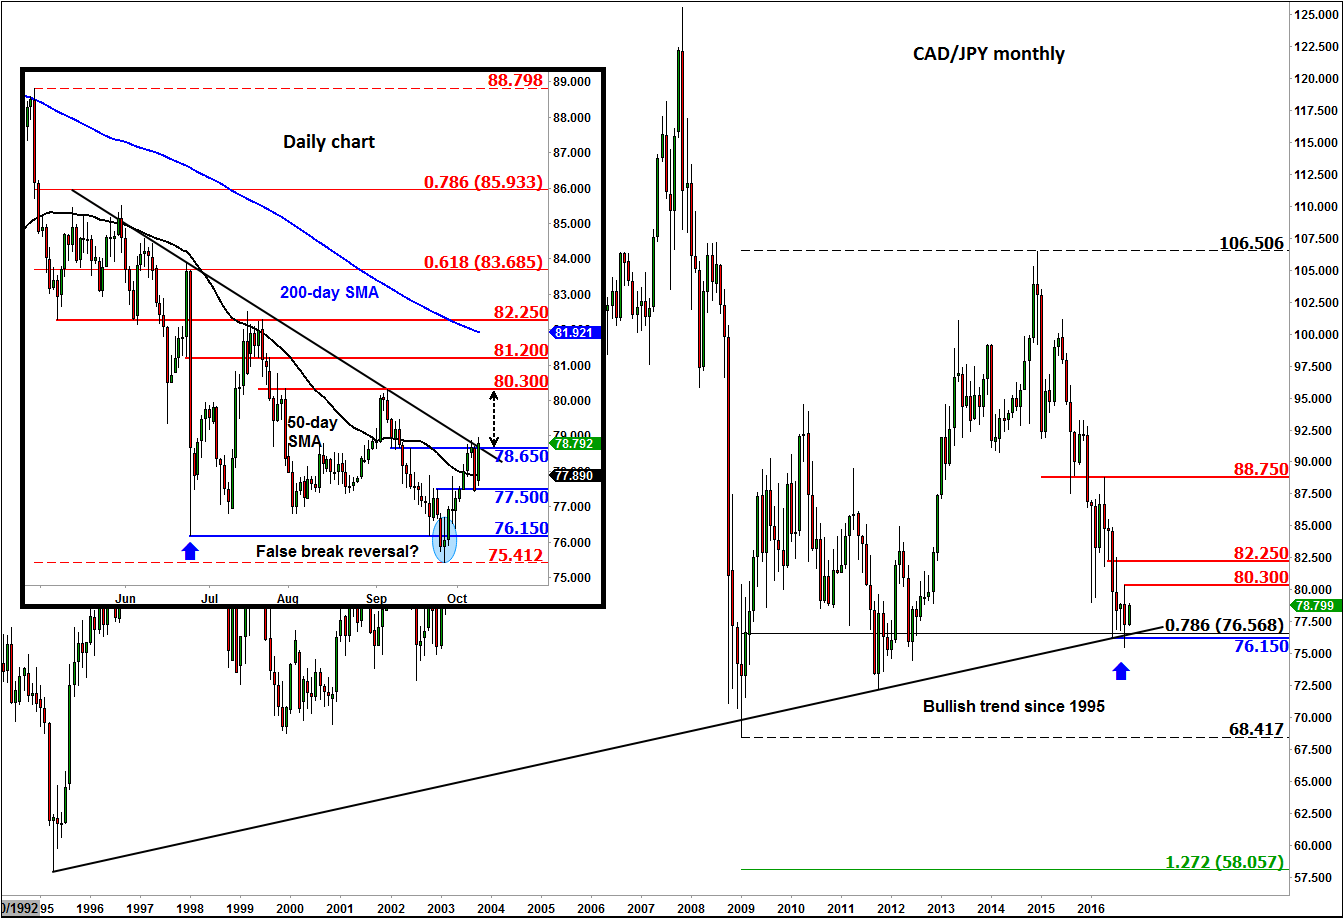
Technical outlook: CAD/JPY
From a technical point of view the CAD/JPY cross is beginning to look quite bullish on all time frames. On the monthly chart, in figure 2, the CAD/JPY has once again held its own above a rising trend line that stretches back to 1995. It has also defended its long-term 78.6% Fibonacci retracement level at around 75.55.
What’s more, the cross may have formed a key reversal pattern on its short-term charts around the June 2016 low of 76.15 (see the daily chart in the inset, in figure 2). After creating that low, the CAD/JPY had one more attempt to break further lower at the end of September. Although it traded below this level for a while, there was no significant follow-though in the selling pressure. As a result, a false breakout pattern may have been created there. Subsequently, the CAD/JPY has bounced back due to a combination of profit-taking from the sellers and opportunistic buying from those who quickly realised that the balance of power was shifting away from the bears.
More gains could be on the way for the CAD/JPY if it now manages to break above its descending trend line around the 78.65/80 area on a daily closing basis. If successful, we could see a rally towards the next swing high at 80.30. Further near-term potential bullish targets are around 81.20 and 82.25, levels that were previously support and/or resistance.
However, if support at 77.50 gives way then there is scope for the CAD/JPY to go for another test of that 76.15 handle. Ultimately though, oil prices will have a big say in the direction of the CAD/JPY and CAD crosses in general.
From time to time, StoneX Financial Pty Ltd (“we”, “our”) website may contain links to other sites and/or resources provided by third parties. These links and/or resources are provided for your information only and we have no control over the contents of those materials, and in no way endorse their content. Any analysis, opinion, commentary or research-based material on our website is for information and educational purposes only and is not, in any circumstances, intended to be an offer, recommendation or solicitation to buy or sell. You should always seek independent advice as to your suitability to speculate in any related markets and your ability to assume the associated risks, if you are at all unsure. No representation or warranty is made, express or implied, that the materials on our website are complete or accurate. We are not under any obligation to update any such material.
As such, we (and/or our associated companies) will not be responsible or liable for any loss or damage incurred by you or any third party arising out of, or in connection with, any use of the information on our website (other than with regards to any duty or liability that we are unable to limit or exclude by law or under the applicable regulatory system) and any such liability is hereby expressly disclaimed.
City Index is a trading name of StoneX Financial Pty Ltd.
The material provided herein is general in nature and does not take into account your objectives, financial situation or needs.
While every care has been taken in preparing this material, we do not provide any representation or warranty (express or implied) with respect to its completeness or accuracy. This is not an invitation or an offer to invest nor is it a recommendation to buy or sell investments.
StoneX recommends you to seek independent financial and legal advice before making any financial investment decision. Trading CFDs and FX on margin carries a higher level of risk, and may not be suitable for all investors. The possibility exists that you could lose more than your initial investment further CFD investors do not own or have any rights to the underlying assets.
It is important you consider our Financial Services Guide and Product Disclosure Statement (PDS) available at www.cityindex.com/en-au/terms-and-policies/, before deciding to acquire or hold our products. As a part of our market risk management, we may take the opposite side of your trade. Our Target Market Determination (TMD) is also available at www.cityindex.com/en-au/terms-and-policies/.
StoneX Financial Pty Ltd, Suite 28.01, 264 George Street, Sydney, NSW 2000 (ACN 141 774 727, AFSL 345646) is the CFD issuer and our products are traded off exchange.
© City Index 2024