nzdusd looks set for a deeper pullback 2677312016
The New Zealand dollar’s recent advance has come to a halt recently after the Reserve Bank of New Zealand suggested that interest rates may need to be cut further from their current record low of 2.0%. The NZD’s retreat has been particularly noticeable against the Australian dollar as the AUD/NZD pair has surged back above 1.0500 after dipping to as low as 1.0240. It looks like the US dollar is also now getting the upper hand on the New Zealand dollar, even though the former has weakened against many other currencies recently, including the Aussie. But there are a couple of things that could impact the USD today: US data in the form of durable goods orders and the Federal Reserve Chairwoman Janet Yellen’s testimony. Unless the data is significantly weak or Yellen says something dovish, expected the NZD/USD to depreciate further.
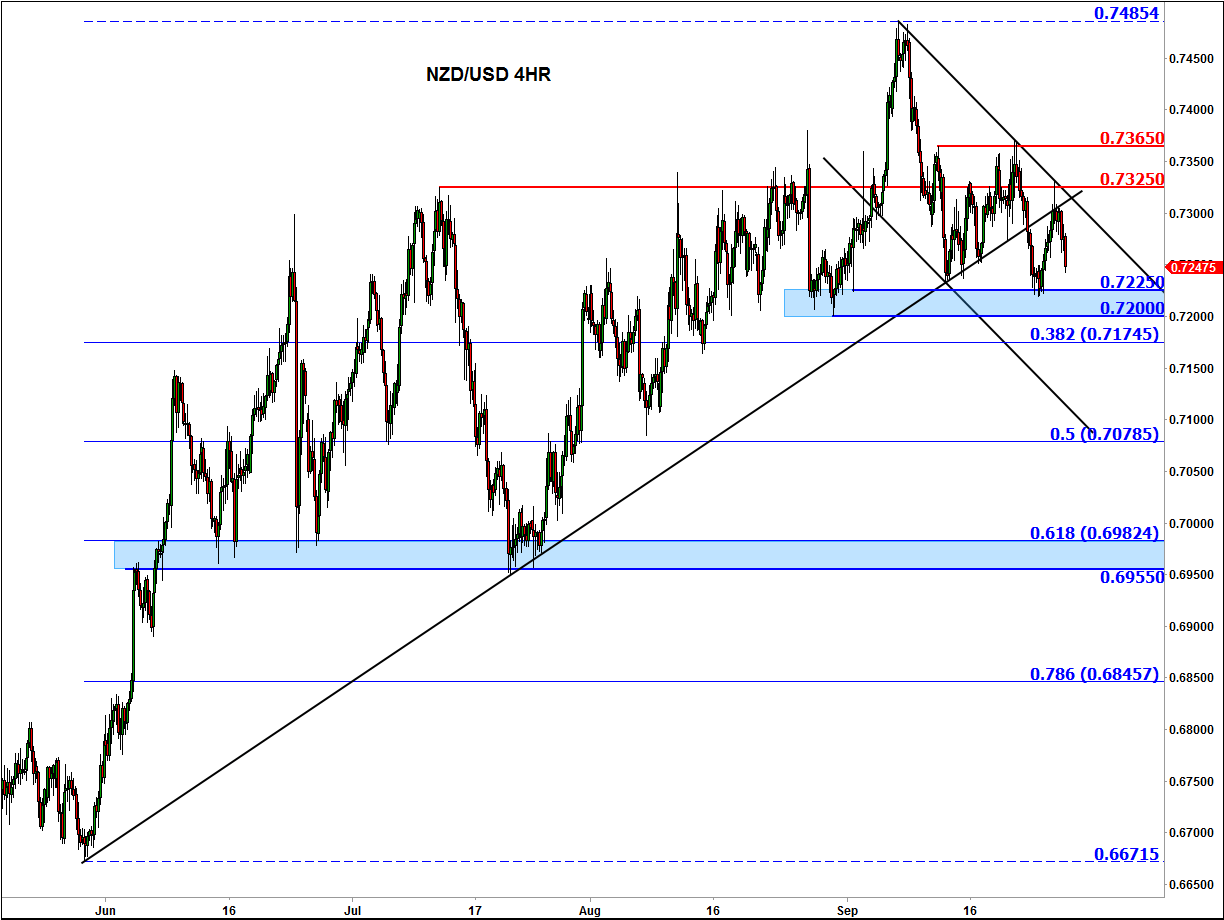
Indeed, the technical outlook on the NZD/USD is beginning to look more and more bearish as key supports give way. As can be seen from the 4-hour chart, below, a bullish trend line has also broken down and the underside of it has since turned into resistance around the 0.7325 resistance level. Meanwhile a bearish channel has now been established after the kiwi put in a couple of lower highs and lower lows. So the path of least resistance on this time frame appears to be to the downside.
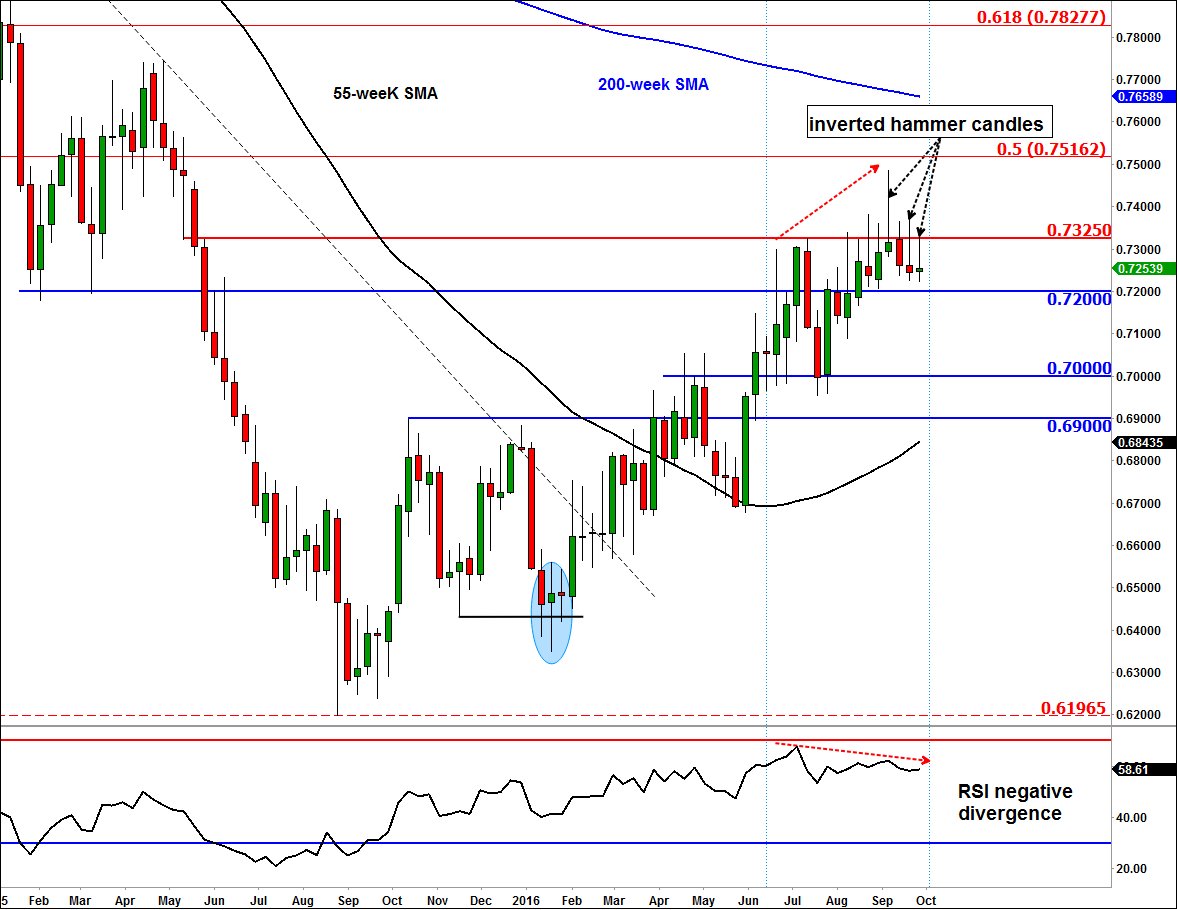
On the weekly chart, the NZD/USD has put in a few inverted hammer candlestick patterns. These candlestick formations suggest that the bullish thrust is fading fast, which is not a big surprise given the magnitude of the upsurge from around 0.6200 in August of last year to a high so of 0.7485 this year. The bullish struggle is confirmed further by the momentum indicator Relative Strength Index (RSI) being in a state of negative divergence (lower low) with price (higher high).
Consequently, the technical indications imply that the kiwi, just like the flightless bird, may not be able to fly but take a parachute jump.
Some of the key potential support levels, or bearish targets, to watch include the area between 0.7200 and 0.7225 which had been support in the past. Below here, the Fibonacci retracements could be additional targets to watch; in particular the 61.8% retracement level around 0.6980/5, because below that lies another key prior low in close proximity at 0.6955 and above it the psychological level of 0.7000 which is also a key support on the weekly time frame.
Our short-term technical bearish bias on this pair would become invalid upon a potential break above the resistance trend of the bearish channel. In that case, actually, the bearish channel would then turn into a bullish flag breakout scenario, which is anything but bearish. So, the key level to watch on the upside is around 0.7325 as a break above it would also re-establish the broken bullish trend line. For now though, the bears appear to be in the driving seat.
From time to time, StoneX Financial Pty Ltd (“we”, “our”) website may contain links to other sites and/or resources provided by third parties. These links and/or resources are provided for your information only and we have no control over the contents of those materials, and in no way endorse their content. Any analysis, opinion, commentary or research-based material on our website is for information and educational purposes only and is not, in any circumstances, intended to be an offer, recommendation or solicitation to buy or sell. You should always seek independent advice as to your suitability to speculate in any related markets and your ability to assume the associated risks, if you are at all unsure. No representation or warranty is made, express or implied, that the materials on our website are complete or accurate. We are not under any obligation to update any such material.
As such, we (and/or our associated companies) will not be responsible or liable for any loss or damage incurred by you or any third party arising out of, or in connection with, any use of the information on our website (other than with regards to any duty or liability that we are unable to limit or exclude by law or under the applicable regulatory system) and any such liability is hereby expressly disclaimed.
City Index is a trading name of StoneX Financial Pty Ltd.
The material provided herein is general in nature and does not take into account your objectives, financial situation or needs.
While every care has been taken in preparing this material, we do not provide any representation or warranty (express or implied) with respect to its completeness or accuracy. This is not an invitation or an offer to invest nor is it a recommendation to buy or sell investments.
StoneX recommends you to seek independent financial and legal advice before making any financial investment decision. Trading CFDs and FX on margin carries a higher level of risk, and may not be suitable for all investors. The possibility exists that you could lose more than your initial investment further CFD investors do not own or have any rights to the underlying assets.
It is important you consider our Financial Services Guide and Product Disclosure Statement (PDS) available at www.cityindex.com/en-au/terms-and-policies/, before deciding to acquire or hold our products. As a part of our market risk management, we may take the opposite side of your trade. Our Target Market Determination (TMD) is also available at www.cityindex.com/en-au/terms-and-policies/.
StoneX Financial Pty Ltd, Suite 28.01, 264 George Street, Sydney, NSW 2000 (ACN 141 774 727, AFSL 345646) is the CFD issuer and our products are traded off exchange.
© City Index 2024