nzdusd how much more kiwi appreciation can rbnz tolerate 2666552016
With the focus being almost entirely on the issue of Brexit and the pound this week – perhaps rightly so – traders should not lose sight of many other tradable opportunities that will present themselves in the interim. For example, the NZD/USD. The Kiwi has been climbing stealthily in recent weeks, due in part to a modest recovery in commodity prices. In addition, the RBNZ implicitly admitted at its June meeting that it is finding it increasingly difficult to loosen policy further when it once again warned of inflation in houses prices in Auckland being among its main financial stability concerns. Also boosting the NZD was last week’s release of Q1 GDP data, which came in surprisingly strong, at 0.7% q/q versus 0.5% expected and 0.9% in Q4.
But despite a modest rebound in key commodity export prices, they remain uncomfortably low and the RBNZ is desperate to push down the value of the New Zealand dollar in order to make the country’s exports appear more attractive for foreigners. It looks like New Zealand’s economy is therefore almost entirely kept up by high levels of immigration, which in turn may be fuelling a bubble in the housing market.
To be fair to the RBNZ, it has already delivered several rate cuts – the most recent one being in May – and continually jawboned the currency lower. However, each time the NZD went down, the buyers have been quick to step in and prop it back up again.
So the NZD has appreciated despite the efforts of the central bank. Obviously with almost all the other major central banks being or turning more dovish, this has made the RBNZ’s job a lot difficult achieve.
Even the USD has weakened for much of this year as the Federal Reserve continually poured cold water on rate hike expectations due to weakness in data at the world’s largest economy. Today, Janet Yellen was at it again as she sounded a tad more dovish than expected at her testimony, though the Federal Reserve Chairwoman didn’t say anything dramatic to cause the USD to weaken or stocks to jump noticeably.
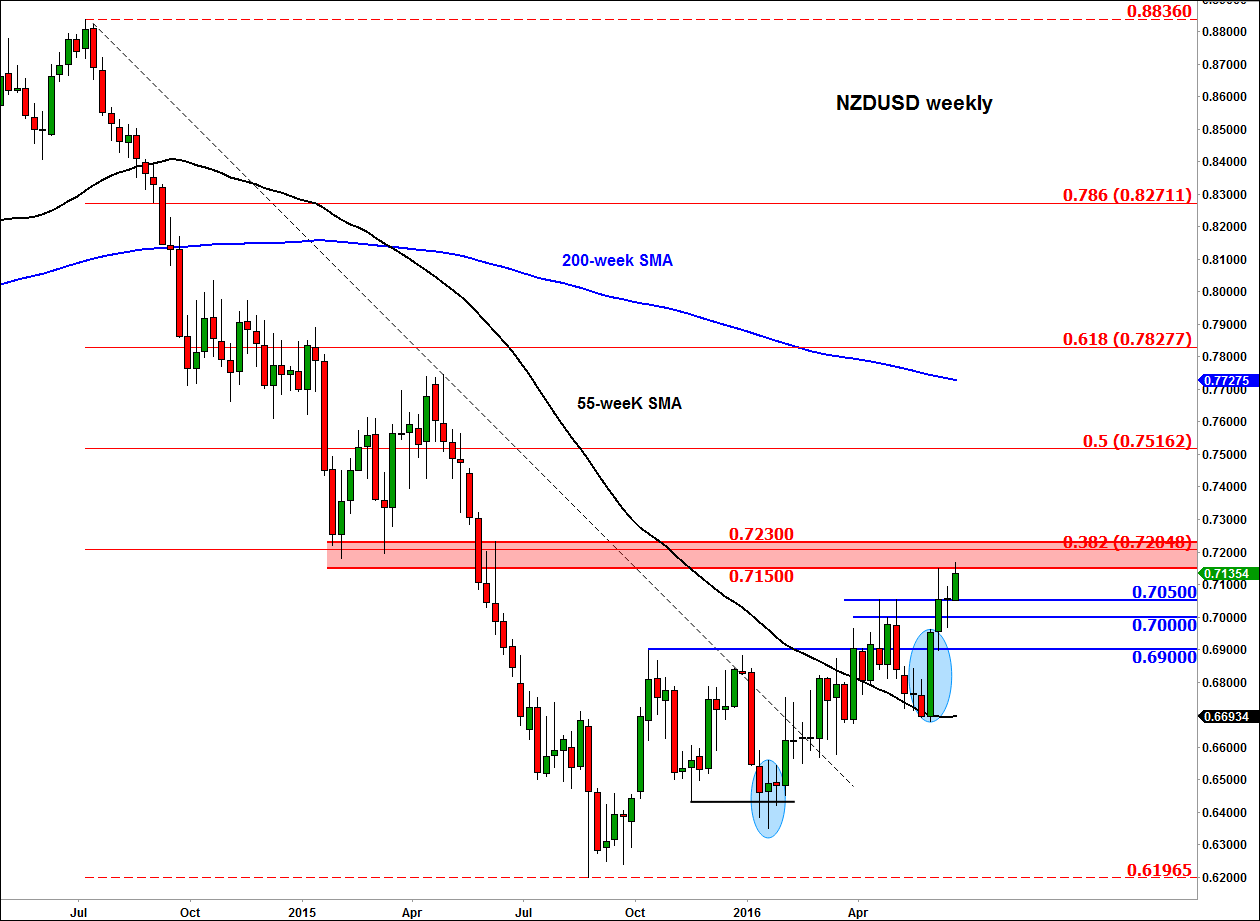
Admittedly, the NZD/USD has “only” risen by about 10 cents from its recent lows of around 0.62 in August 2015, which is not a massive move, although not a small one either. But should the exchange rate appreciate more then there is so much the RBNZ could tolerate, even if it means further deterioration of the housing problem.
Of course, the market can also correct itself if enough people are convinced that the NZD/USD may be overvalued. One area we may see this happen is around the technically-important 0.7150-0.7230 region, which I have highlighted in red on the chart, below. This area is a key reference point for traders due to the nature of prior price action around here. Will this support-turned-resistance region provide a ceiling to prices? At the very least, we may see a reaction from this region which could lead to a short-term pullback towards the support levels shown on the chart. However, if price breaks above this region, then this could lead to renewed buying momentum, possibly towards 0.75. This potential scenario will no doubt raise the prospects of a rate cut by the RBNZ, if there is no corresponding rise in economic data surprises. So whichever way you look at it, the kiwi’s upside potential looks limited.
From time to time, StoneX Financial Pty Ltd (“we”, “our”) website may contain links to other sites and/or resources provided by third parties. These links and/or resources are provided for your information only and we have no control over the contents of those materials, and in no way endorse their content. Any analysis, opinion, commentary or research-based material on our website is for information and educational purposes only and is not, in any circumstances, intended to be an offer, recommendation or solicitation to buy or sell. You should always seek independent advice as to your suitability to speculate in any related markets and your ability to assume the associated risks, if you are at all unsure. No representation or warranty is made, express or implied, that the materials on our website are complete or accurate. We are not under any obligation to update any such material.
As such, we (and/or our associated companies) will not be responsible or liable for any loss or damage incurred by you or any third party arising out of, or in connection with, any use of the information on our website (other than with regards to any duty or liability that we are unable to limit or exclude by law or under the applicable regulatory system) and any such liability is hereby expressly disclaimed.
City Index is a trading name of StoneX Financial Pty Ltd.
The material provided herein is general in nature and does not take into account your objectives, financial situation or needs.
While every care has been taken in preparing this material, we do not provide any representation or warranty (express or implied) with respect to its completeness or accuracy. This is not an invitation or an offer to invest nor is it a recommendation to buy or sell investments.
StoneX recommends you to seek independent financial and legal advice before making any financial investment decision. Trading CFDs and FX on margin carries a higher level of risk, and may not be suitable for all investors. The possibility exists that you could lose more than your initial investment further CFD investors do not own or have any rights to the underlying assets.
It is important you consider our Financial Services Guide and Product Disclosure Statement (PDS) available at www.cityindex.com/en-au/terms-and-policies/, before deciding to acquire or hold our products. As a part of our market risk management, we may take the opposite side of your trade. Our Target Market Determination (TMD) is also available at www.cityindex.com/en-au/terms-and-policies/.
StoneX Financial Pty Ltd, Suite 28.01, 264 George Street, Sydney, NSW 2000 (ACN 141 774 727, AFSL 345646) is the CFD issuer and our products are traded off exchange.
© City Index 2024