Market Brief Trump Impeached
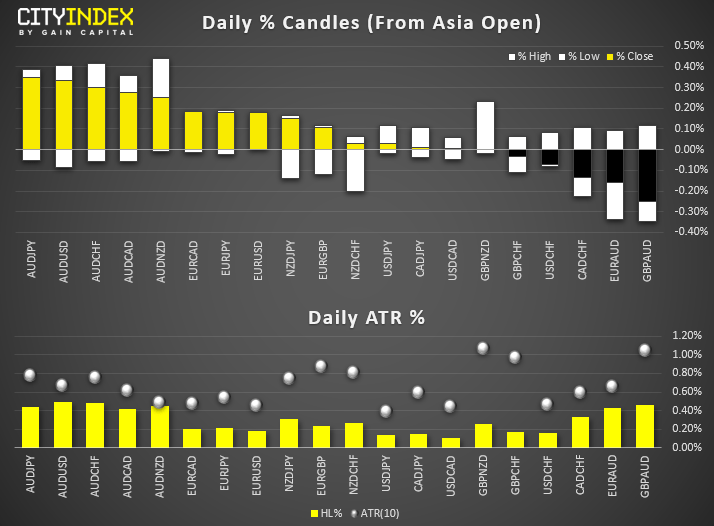
View our guide on how to interpret the FX Dashboard
- Trump became the third US president in history to be impeached. The first article was 230-197 in favour of ‘abuse of power’ and the second was 229-198 on ‘obstruction of congress’. Whilst this means a Republican-led Senate trial will now be held, Trump is not expected to be ousted by his GOP chums. Meanwhile, Trump was lashing out at Democrats during his Michigan rally.
- Australian employment data finished the year on a brighter note, with unemployment falling to 5.2% with 39.9k jobs added (25.9k better than expected). This saw odds of a Feb cut fall from 60% to 45%.
- BOJ stand pat (again) at their final meeting of the year, keeping rates at -0.1% and their 10-year JGBP yield at around 0%.
- Little to no reaction from the highly publicised impeachment hearing. But then we all expected it, and it’s not likely to result in removal of office anyway.
- AUD and EUR are the strongest majors, JPY is the weakest.
Price Action:
- NZD/USD produced a bullish outside candle which could also serve as part of a 2-bar reversal, suggesting the swing low is in at 0.6555. A break above 0.6615 assumes bullish continuation.
- USD/CAD trades within a bearish channel on the four-hour chart and is consolidating near 1.3110 support. The bias is for a break to new lows whilst the bearish channel holds.
- AUD/USD has likely seen a temporary low at 0.6835, so bullish momentum could favour bulls in the UK and US sessions.
- GBP/USD is holding above 1.3050 ahead of today’s BOE meeting. Whilst the fear of a Bojo hard Brexit and soft inflation figures have weighed on GBP post-election, we expect no change form BOE later today which leaves potential for a bounce higher.
Equities brief:
- Key Asian stock markets have started to see profit-taking activities as we head into thinner liquidity conditions ahead of the Christmas holiday season next week.
- Losses have been muted despite the U.S. House of Representatives, controlled by Democrats that has impeached U.S. President Trump officially which has been priced into the market. The impeachment trial now heads to the Senate in Jan 2020 where the Democrats will face a major hurdle to overcome the Republican votes as they control a majority stake in the Senate.
- The worst performer so far is from Hong Kong’s Hang Seng Index (HSI) which has recorded a loss of -0.60% after its stellar performance last week that saw a gain of 4.4%, the best in 3-month since Sep 2019. Today’s drip can be attributed mainly to technical factors as the HSI has almost reached a major resistance of 28200.
Price Acton (derived from CFD indices):
- Japan 225: Despite the 1.5% decline from its 17 Dec high of 24168, the minor uptrend remains intact with the current price action that is now hovering just above the 23770 key short-term support at 23770 with a bullish divergence seen in the hourly RSI oscillator at its oversold region. A break above 24000 reinforces the start of another potential upleg.
- Hong Kong 50: Retreated just below the 28200 major resistance (61.8% Fibonacci retracement of the previous decline from 03 May high to 15 Aug 2019 low & the descending trendline from 29 Jan 2018 all-time high). May see a further slide to retest 27400/200 near-term support zone (also the former range resistance of 19 Nov/26 Nov 2019) with key short-term resistance now at 28000 (yesterday high that has stalled the bulls so far in today’s Asia session).
- Australia 200: Minor pull-back/consolidation mode remains in progress below the 6880/90 all-time high area towards the 6780 max 6740 key medium-term support before a potential upleg unfolds next.
- Germany 30: The on-going pull-back from 13428 high of 16 Dec has reached the 13250/200 key short-term support 13 Dec 2019 minor swing low & the pull-back support of the “flag” former resistance) with hourly RSI & Stochastic oscillators in oversold conditions (where a potential upleg may materialise next. Watch the 13300 intermediate resistance and a break above it reinforces the bullish upleg scenario.
- US SP 500: Traded sideways above 3177 key short-term support (minor ascending trendline from 12 Dec 2019 low & Fibonacci retracement cluster). Uptrend remains intact with a potential push up to target 3220 resistance next (Fibonacci expansion & upper boundary of a minor ascending channel from 03 Dec 2019 low).
Matt Simpson and Kelvin Wong both contributed to this article
Data from Refinitiv. Index names may not reflect tradable instruments and not all markets are available in all regions.From time to time, StoneX Financial Pty Ltd (“we”, “our”) website may contain links to other sites and/or resources provided by third parties. These links and/or resources are provided for your information only and we have no control over the contents of those materials, and in no way endorse their content. Any analysis, opinion, commentary or research-based material on our website is for information and educational purposes only and is not, in any circumstances, intended to be an offer, recommendation or solicitation to buy or sell. You should always seek independent advice as to your suitability to speculate in any related markets and your ability to assume the associated risks, if you are at all unsure. No representation or warranty is made, express or implied, that the materials on our website are complete or accurate. We are not under any obligation to update any such material.
As such, we (and/or our associated companies) will not be responsible or liable for any loss or damage incurred by you or any third party arising out of, or in connection with, any use of the information on our website (other than with regards to any duty or liability that we are unable to limit or exclude by law or under the applicable regulatory system) and any such liability is hereby expressly disclaimed.
City Index is a trading name of StoneX Financial Pty Ltd.
The material provided herein is general in nature and does not take into account your objectives, financial situation or needs.
While every care has been taken in preparing this material, we do not provide any representation or warranty (express or implied) with respect to its completeness or accuracy. This is not an invitation or an offer to invest nor is it a recommendation to buy or sell investments.
StoneX recommends you to seek independent financial and legal advice before making any financial investment decision. Trading CFDs and FX on margin carries a higher level of risk, and may not be suitable for all investors. The possibility exists that you could lose more than your initial investment further CFD investors do not own or have any rights to the underlying assets.
It is important you consider our Financial Services Guide and Product Disclosure Statement (PDS) available at www.cityindex.com/en-au/terms-and-policies/, before deciding to acquire or hold our products. As a part of our market risk management, we may take the opposite side of your trade. Our Target Market Determination (TMD) is also available at www.cityindex.com/en-au/terms-and-policies/.
StoneX Financial Pty Ltd, Suite 28.01, 264 George Street, Sydney, NSW 2000 (ACN 141 774 727, AFSL 345646) is the CFD issuer and our products are traded off exchange.
© City Index 2024