Lloyds shares recoup after final PPI hit
Last-minute PPI sting won’t be fatal for pay-out plans
As it was for Lloyds Banking Group’s main rivals, the tail of the PPI saga had a sharper sting than expected. Charges related to remediation costs for the two-decade long insurance mis-selling issue amounted to £1.80bn in Q3, against £1.67bn expected by analysts. The harsher than forecast hit partly reflects a last-minute gush of compensation claims that brought Lloyds' buyback plans to an abrupt halt in September.
The group is arguably the best-defended and best-positioned bank focused on the UK for revenues. Yet it is just as hemmed in by economic challenges as peers. Consequently, substantially accelerated growth remains a distant goal. Shareholders have thereby been more focused on capital growth and prospective returns to assess their investment in recent years. So even the hint of a risk to expected higher dividends and share buybacks can be a big deal, particularly with PPI impact also consuming profit targets for the year. (The trading statement didn’t update the bank’s view on its Return on Tangible Equity goal for 2019).
Still, such concerns have been reflected in contained fashion by share price moves in Lloyds stock on Thursday. It retreated by somewhat less than 3% at worst and curbed the loss to about 2% by late morning. Despite Q3 upsets, the buffer of capital Lloyds is obliged to hold as a ratio of total assets improved by a satisfactory extent in Q3. Common Equity Tier 1 Capital stood at 13.5% by quarter end, “in line with the board’s target”. As such, management emits no change to dividend plans and “will give due consideration to the return of any surplus capital at the year end.” Meanwhile, “never say never”, the advice on PPI offered by Lloyds’ previous CEO, remains wise, though post-deadline, claim volumes will continue to decline.
Q3 2019 is yet another quarter Lloyds investors would prefer to forget and that’s reflected in a ten percentage-point share price drop over the last ten days. Still, a firm net interest margin emerged as one of the few high points of the quarter at 2.88% vs. 2.87% expected. Cost control also remained in hand. Lloyds is not compounding past mistakes with new missteps.
Chart points
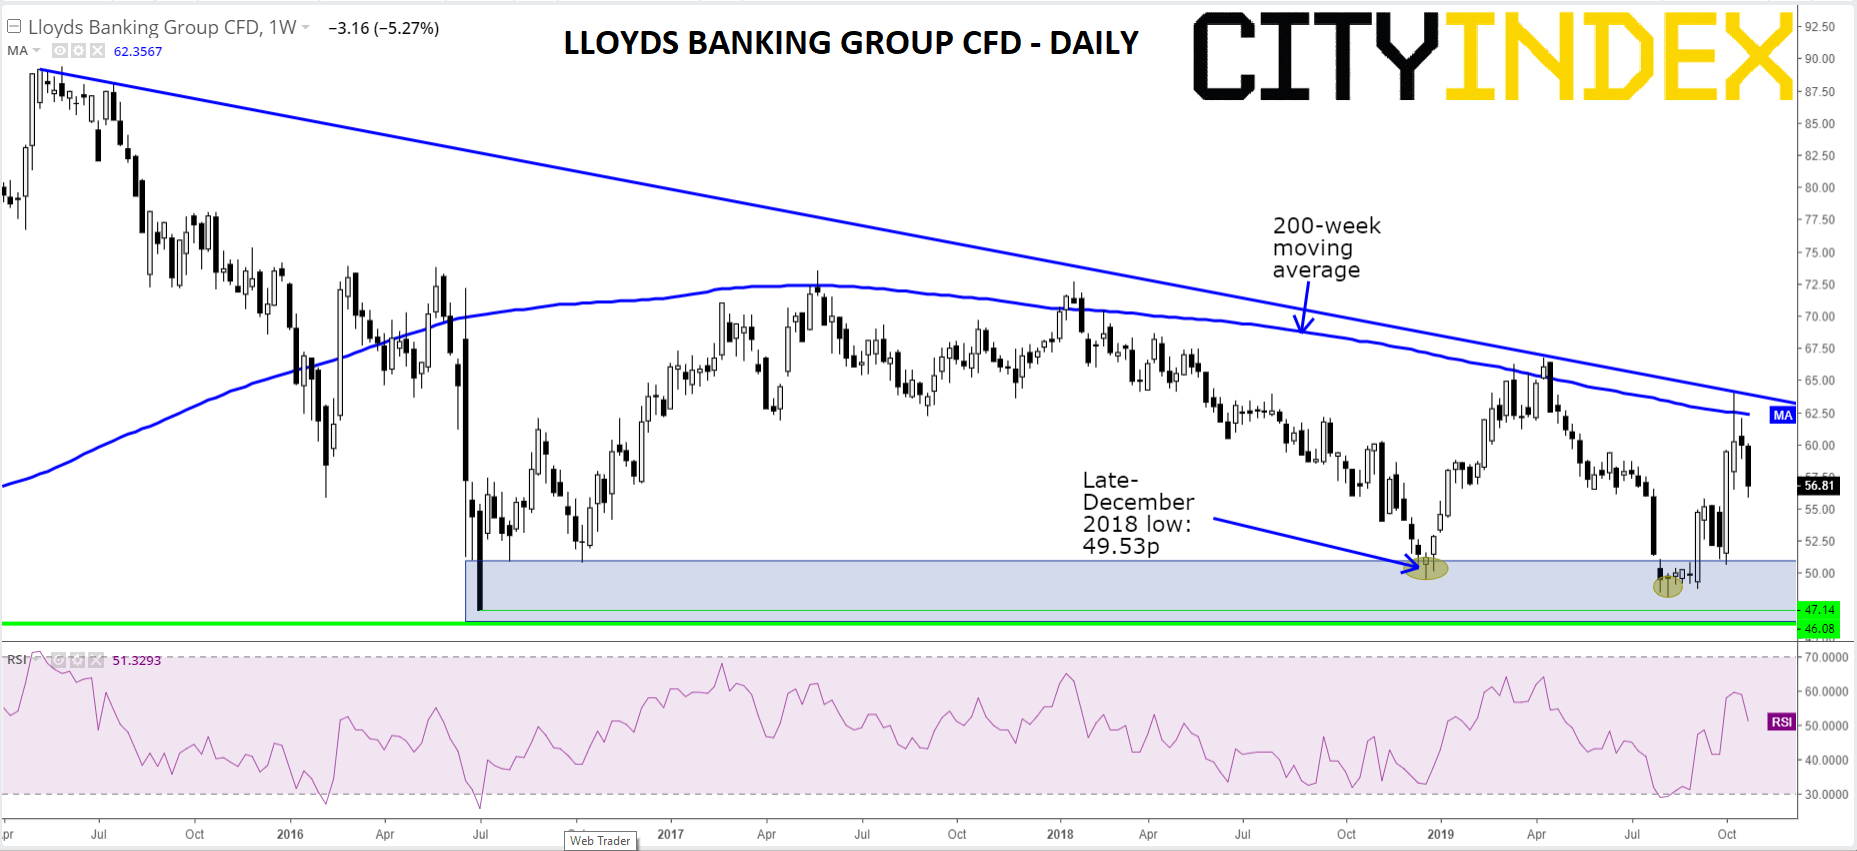
Over-arching pressure on the shares that could erode more of LLOY’s remaining 9% rise this year should continue, according to technical analysis. The decline since May 2015 is now well established: see the well-corroborated falling trend line since then that was last tagged in mid-October. The 200-week moving average reinforces trend line resistance given that mid-October also featured another failed attempt to get above the 200-WMA, the latest of many rejections in recent years. So long as overhead structures remain intact, objectives will continue to point towards December 2018’s base at 49.53p, and 2019’s 48.2p low from August. These floors are in within reasonable range of June 2016’s post-referendum lows as deep as 46p.
Lloyds Banking Group Plc. CFD – Weekly
Source: City Index
From time to time, StoneX Financial Pty Ltd (“we”, “our”) website may contain links to other sites and/or resources provided by third parties. These links and/or resources are provided for your information only and we have no control over the contents of those materials, and in no way endorse their content. Any analysis, opinion, commentary or research-based material on our website is for information and educational purposes only and is not, in any circumstances, intended to be an offer, recommendation or solicitation to buy or sell. You should always seek independent advice as to your suitability to speculate in any related markets and your ability to assume the associated risks, if you are at all unsure. No representation or warranty is made, express or implied, that the materials on our website are complete or accurate. We are not under any obligation to update any such material.
As such, we (and/or our associated companies) will not be responsible or liable for any loss or damage incurred by you or any third party arising out of, or in connection with, any use of the information on our website (other than with regards to any duty or liability that we are unable to limit or exclude by law or under the applicable regulatory system) and any such liability is hereby expressly disclaimed.
City Index is a trading name of StoneX Financial Pty Ltd.
The material provided herein is general in nature and does not take into account your objectives, financial situation or needs.
While every care has been taken in preparing this material, we do not provide any representation or warranty (express or implied) with respect to its completeness or accuracy. This is not an invitation or an offer to invest nor is it a recommendation to buy or sell investments.
StoneX recommends you to seek independent financial and legal advice before making any financial investment decision. Trading CFDs and FX on margin carries a higher level of risk, and may not be suitable for all investors. The possibility exists that you could lose more than your initial investment further CFD investors do not own or have any rights to the underlying assets.
It is important you consider our Financial Services Guide and Product Disclosure Statement (PDS) available at www.cityindex.com/en-au/terms-and-policies/, before deciding to acquire or hold our products. As a part of our market risk management, we may take the opposite side of your trade. Our Target Market Determination (TMD) is also available at www.cityindex.com/en-au/terms-and-policies/.
StoneX Financial Pty Ltd, Suite 28.01, 264 George Street, Sydney, NSW 2000 (ACN 141 774 727, AFSL 345646) is the CFD issuer and our products are traded off exchange.
© City Index 2024