Lloyds flags uncertainty for outlook warning
A last-minute surge of PPI costs damped the quarter but that is the least of the bank’s worries
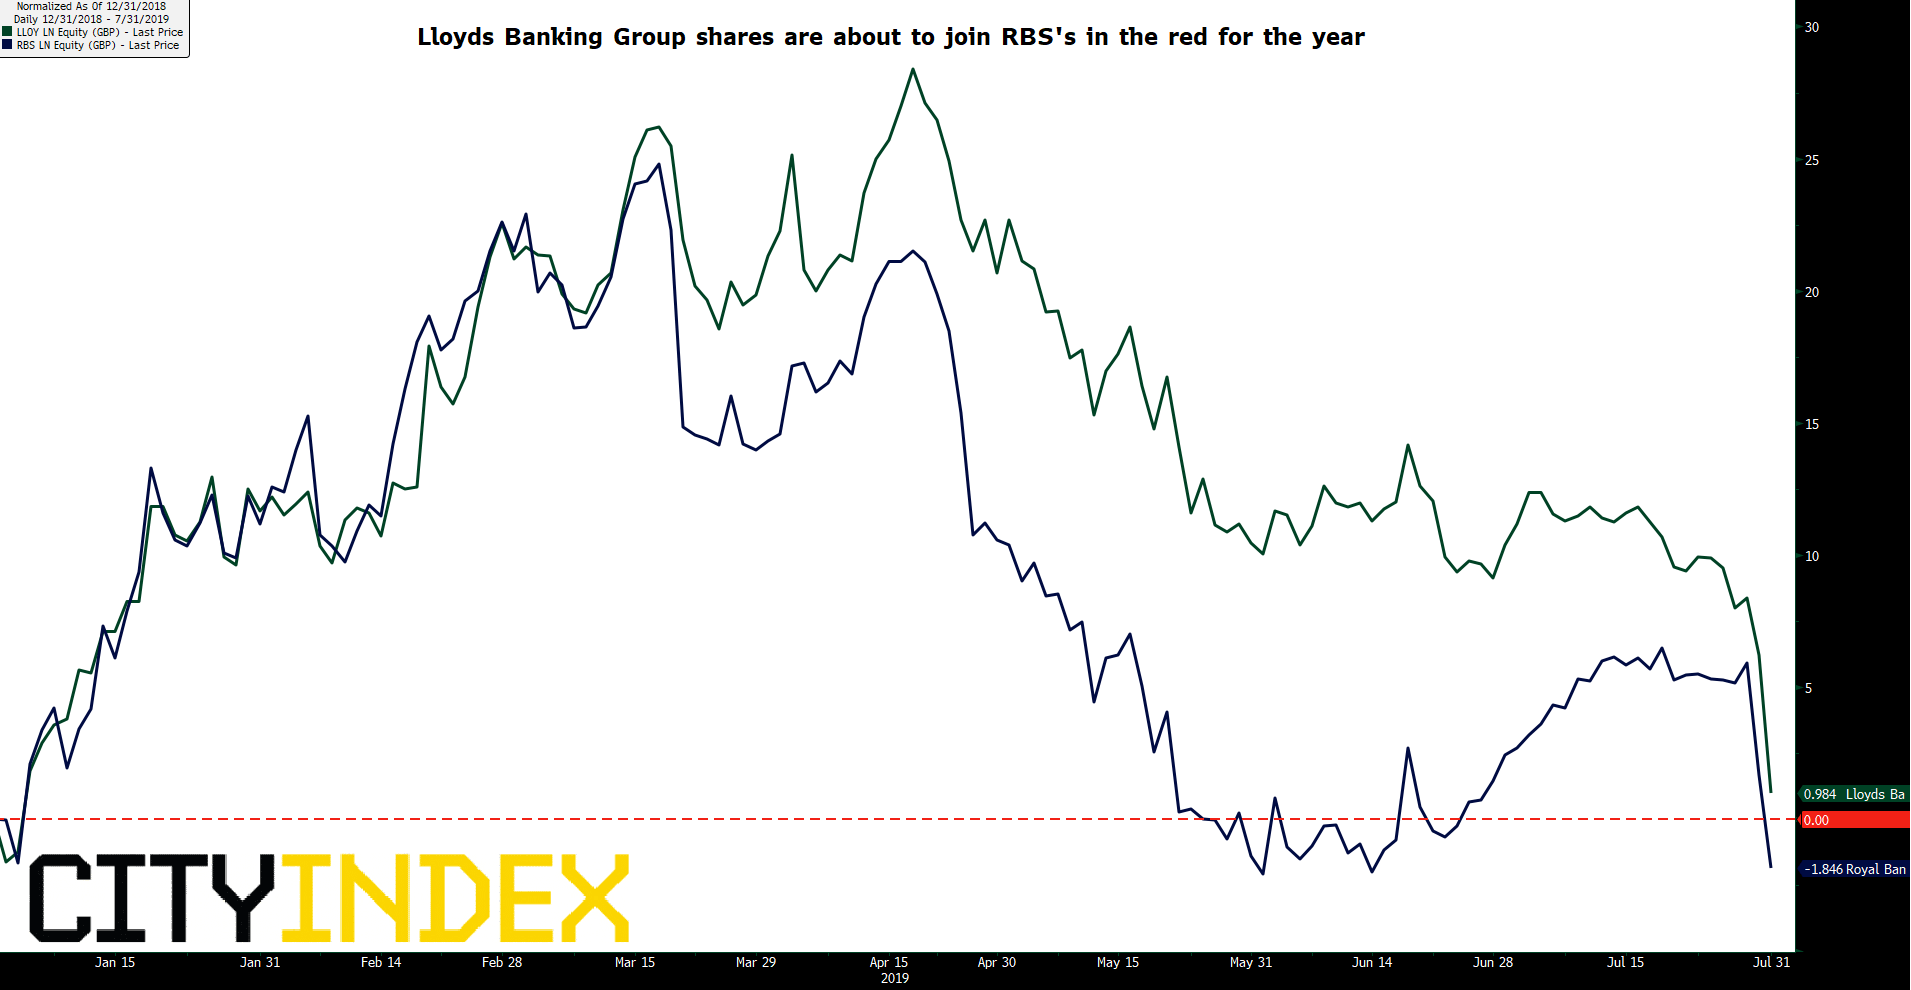
It’s difficult to see how Lloyds Banking Group could have performed more robustly given the specific challenges of the quarter. Looked at this way, perhaps the accelerated downturn of its shares on Wednesday is not entirely justified. The bigger picture helps explain why investor confidence continues to ebb. At last check, the shares had trimmed 4% more off a 2019 advance that stood almost 30% higher at mid-April. Now, they’re barely up 2% for the year and looking likely to turn negative.
The bank points to a fresh charge of £500m linked to payment protection insurance (PPI) as primarily responsible for missed second-quarter expectations.
The key misses
- Statutory pre-tax profit: £1.294bn vs. £1.76bn estimate
- 2Q net interest income: £3.06bn vs. £3.16bn consensus
- 2Q underlying profit: £2.03bn, below company-compiled £2.05bn consensus
- 2Q net interest margin: 2.89% vs. 2.94% estimate
Bloomberg consensus unless specified
But beyond the headline misses, the outlook weighs more. Hopes were pinned on the possibility that rising efficiency and lower regulatory and business capital needs, could enable swifter dividends rises and share buybacks. The interim dividend rose 5% to 1.12 pence; in line with expectations, which is exactly the point.
“Below the line charges”, including the last-minute wave of PPI costs have scuppered those hopes for now. Lloyds’ boast of sufficient capital for growth, regulatory requirements, uncertainty and a ‘management buffer’, have come a cropper as it now expects 2019 leeway to be at the lower end of a 170-200 basis point range. It implies that’s the reason why it’s holding back from a nearer term increase of capital returns. A fairly solid first-half despite misses adds a random variable.
- Total costs fell a more than forecast 5%, operating costs -3%
- Cost: income ratio on course for low 40% levels by end-2020, better than comparable rivals
- The wealth management push is bearing early fruit whilst insurance is stable
“Continued economic uncertainty could impact” the outlook as clarified on Wednesday, the bank says. Despite economic “resilience” it is nodding to Brexit risks for a decision to hang fire on pay-outs, perhaps for even longer than the first quarter of 2020.
More broadly, if the first half was sobering for Lloyds investors, it should be more worrying for RBS holders. They will find out how that bank fared in the first half on Friday. RBS faces a sharper delta from declining economic confidence and is the runner-up in Britain’s mortgage market. The stock was down 3% at time of writing and is slightly weaker for the year than Lloyds’. On the basis of results from its bigger rival, it’s set to continue leading the downside.
Normalised: Lloyds Banking Group, RBS – year-to-date [31/07/2019 13:14:42]
Source: Bloomberg/City Index
From time to time, StoneX Financial Pty Ltd (“we”, “our”) website may contain links to other sites and/or resources provided by third parties. These links and/or resources are provided for your information only and we have no control over the contents of those materials, and in no way endorse their content. Any analysis, opinion, commentary or research-based material on our website is for information and educational purposes only and is not, in any circumstances, intended to be an offer, recommendation or solicitation to buy or sell. You should always seek independent advice as to your suitability to speculate in any related markets and your ability to assume the associated risks, if you are at all unsure. No representation or warranty is made, express or implied, that the materials on our website are complete or accurate. We are not under any obligation to update any such material.
As such, we (and/or our associated companies) will not be responsible or liable for any loss or damage incurred by you or any third party arising out of, or in connection with, any use of the information on our website (other than with regards to any duty or liability that we are unable to limit or exclude by law or under the applicable regulatory system) and any such liability is hereby expressly disclaimed.
City Index is a trading name of StoneX Financial Pty Ltd.
The material provided herein is general in nature and does not take into account your objectives, financial situation or needs.
While every care has been taken in preparing this material, we do not provide any representation or warranty (express or implied) with respect to its completeness or accuracy. This is not an invitation or an offer to invest nor is it a recommendation to buy or sell investments.
StoneX recommends you to seek independent financial and legal advice before making any financial investment decision. Trading CFDs and FX on margin carries a higher level of risk, and may not be suitable for all investors. The possibility exists that you could lose more than your initial investment further CFD investors do not own or have any rights to the underlying assets.
It is important you consider our Financial Services Guide and Product Disclosure Statement (PDS) available at www.cityindex.com/en-au/terms-and-policies/, before deciding to acquire or hold our products. As a part of our market risk management, we may take the opposite side of your trade. Our Target Market Determination (TMD) is also available at www.cityindex.com/en-au/terms-and-policies/.
StoneX Financial Pty Ltd, Suite 28.01, 264 George Street, Sydney, NSW 2000 (ACN 141 774 727, AFSL 345646) is the CFD issuer and our products are traded off exchange.
© City Index 2024