Its Gap Galore Around Middle East Tensions
In response to the US airstrike which killed two senior pro-Iranian officials, the Iraqi parliament voted to dispel foreign troops, in a move which would make US presence in Iraq an occupation (an invasion). There are currently around 5000 US troops Iraq.
There had been speculation that Iran were planning to retaliate via cyberattacks or targeting US bases and civilians. And by Saturday, the homepage of the US government library’s website had been altered to show a picture of Trump being punched in the face alongside a pro-Iranian message. In a bid to fend off attacks against US civilians or bases, President Trump tweeted a stern warning against such move.
“The United States just spent Two Trillion Dollars on Military Equipment. We are the biggest and by far the BEST in the World! If Iran attacks an American Base, or any American, we will be sending some of that brand new beautiful equipment their way...and without hesitation!”.
Well, not everyone appeared to have read the tweet, or it was simply ignored. Hours ago it’s been reported that one an attack on a military base in Kenya resulted in the death of a US military service member and two US contractors. Oh, and that Donald Trump has an $80 million bounty for ‘his head’. So, tensions are unlikely to recede any time soon.
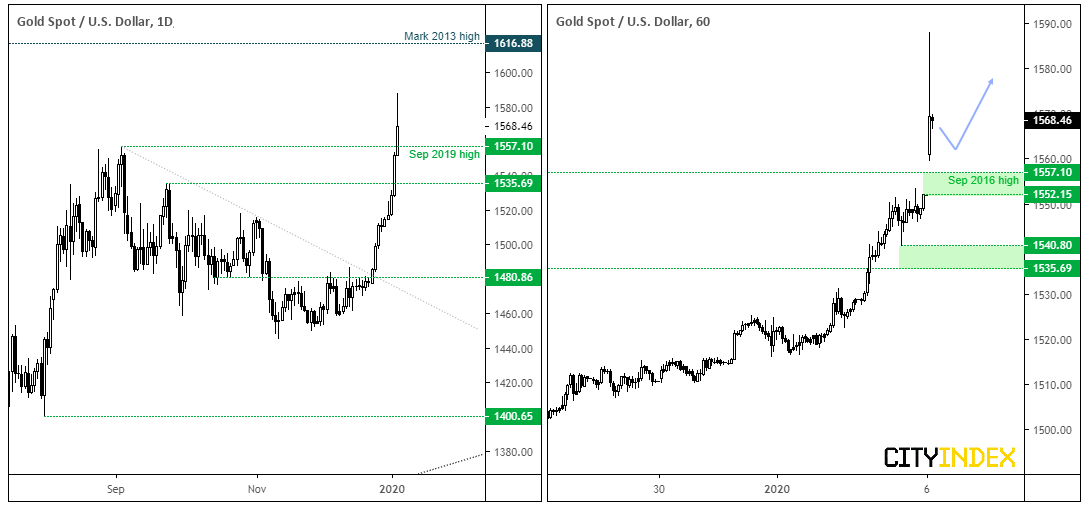
XAU/USD: Gold prices were already soaring ahead of the weekend but developments since Friday’s close have resulted in an explosive move higher. Between Fridays close and today’s high, it’s appreciated an impressive $36, bringing its current 2-day total to over $61.
When events of this magnitude unfold, traditional technical analysis techniques such as overbought/oversold and sometimes key levels bare little relevance. As just one example, net-long exposure to gold has been signalling a sentiment extreme since August yet that hasn’t stopped speculators pushing the yellow metal materially higher. So, whilst tensions remain elevated, the bullish bias on gold remain despite many signs of overextension on a technical basis. Of course, if we somehow see these tensions fully recede, gold could find itself vulnerable to a heavy sell-off.
For now, the September high and Friday’s close suggest a zone of support around 1552. Given we’ve seen such a large spike on the hourly, traders may want to see prices consolidate further before entering unless we see fresh developments supporting gold further.
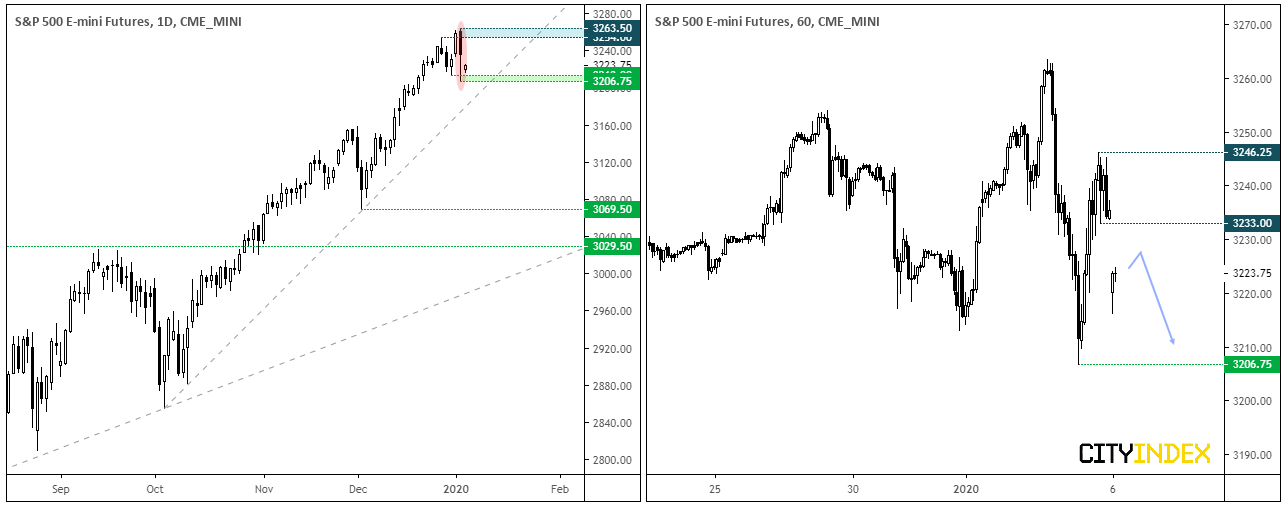
S&P 500 E-mini Future: The index closed the week with a bearish engulfing, outside week (both the open-close and high-low engulfed their respective prior session). Whilst this may or may not prove to be the beginning of a larger correction, bears are in control over the near-term and the bullish trendline from the October low make a viable target.
- The hourly chart is consolidating after gapping lower, making 3233 a level for bears to consider fading into.
- 3026 is the initial bearish target, whereas a break beneath it brings the October trendline into focus.
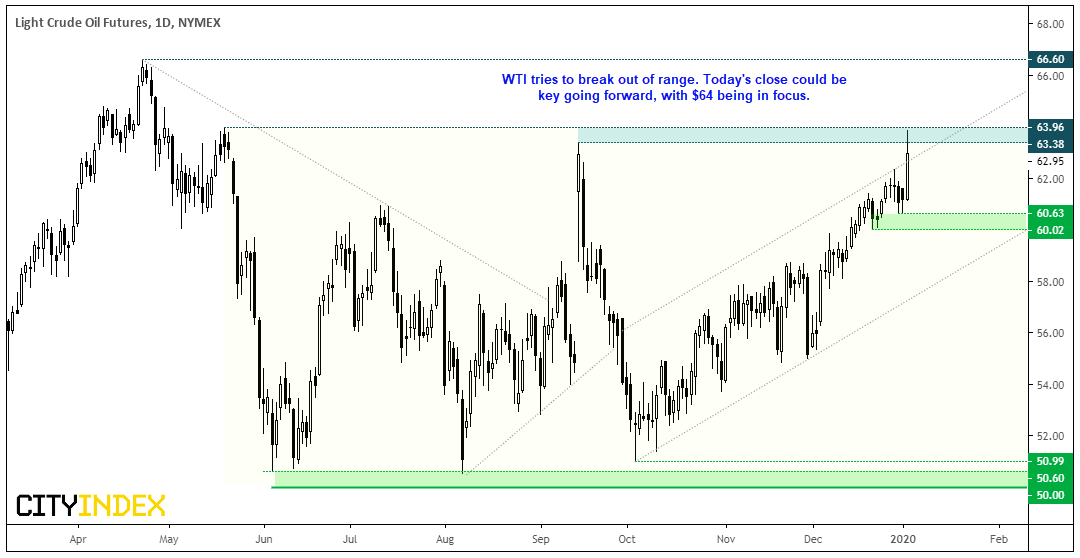
WTI: As outlined on Friday, $64 is a pivotal level and despite gapping higher over the weekend, continues to cap as resistance. In similar vein to gold and S&P futures, traders would be wise to wait for a retracement and / or volatility to subside before committing although the direction for WTI is less clear given it remains below key support. SO around current levels, WTI could better serve as a sentiment tool to use alongside gold and S&P, or simply wait for a break above $64 to assume bullish trend continuation.
Related Analysis:
Gold – A Thing of Beauty
OIL MARKET WEEK AHEAD: Iran’s Possible Scenarios
From time to time, StoneX Financial Pty Ltd (“we”, “our”) website may contain links to other sites and/or resources provided by third parties. These links and/or resources are provided for your information only and we have no control over the contents of those materials, and in no way endorse their content. Any analysis, opinion, commentary or research-based material on our website is for information and educational purposes only and is not, in any circumstances, intended to be an offer, recommendation or solicitation to buy or sell. You should always seek independent advice as to your suitability to speculate in any related markets and your ability to assume the associated risks, if you are at all unsure. No representation or warranty is made, express or implied, that the materials on our website are complete or accurate. We are not under any obligation to update any such material.
As such, we (and/or our associated companies) will not be responsible or liable for any loss or damage incurred by you or any third party arising out of, or in connection with, any use of the information on our website (other than with regards to any duty or liability that we are unable to limit or exclude by law or under the applicable regulatory system) and any such liability is hereby expressly disclaimed.
City Index is a trading name of StoneX Financial Pty Ltd.
The material provided herein is general in nature and does not take into account your objectives, financial situation or needs.
While every care has been taken in preparing this material, we do not provide any representation or warranty (express or implied) with respect to its completeness or accuracy. This is not an invitation or an offer to invest nor is it a recommendation to buy or sell investments.
StoneX recommends you to seek independent financial and legal advice before making any financial investment decision. Trading CFDs and FX on margin carries a higher level of risk, and may not be suitable for all investors. The possibility exists that you could lose more than your initial investment further CFD investors do not own or have any rights to the underlying assets.
It is important you consider our Financial Services Guide and Product Disclosure Statement (PDS) available at www.cityindex.com/en-au/terms-and-policies/, before deciding to acquire or hold our products. As a part of our market risk management, we may take the opposite side of your trade. Our Target Market Determination (TMD) is also available at www.cityindex.com/en-au/terms-and-policies/.
StoneX Financial Pty Ltd, Suite 28.01, 264 George Street, Sydney, NSW 2000 (ACN 141 774 727, AFSL 345646) is the CFD issuer and our products are traded off exchange.
© City Index 2024