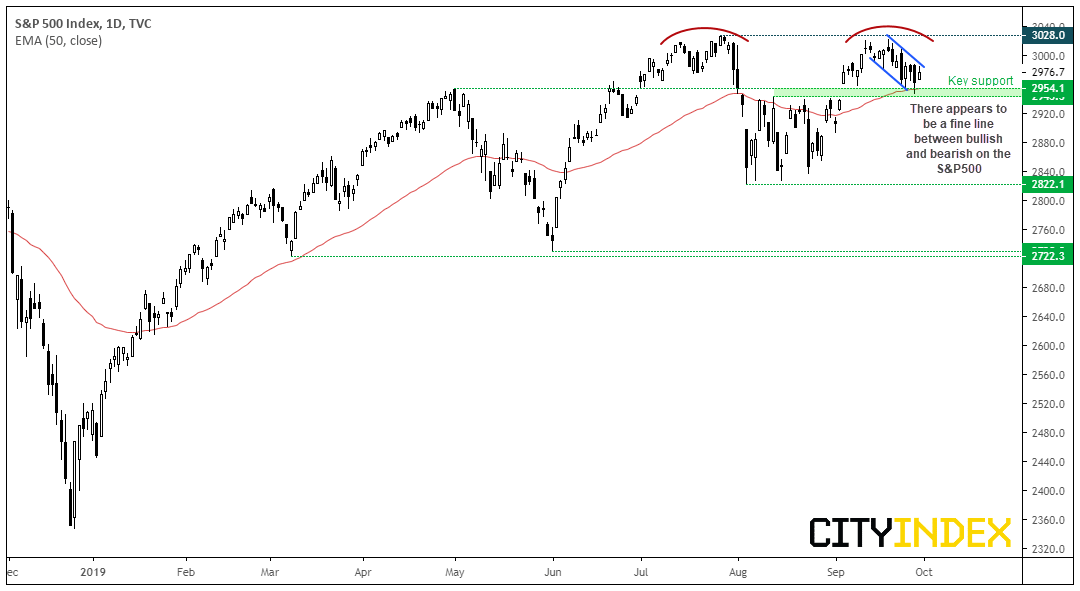
Its A Fine Line Between Bullish and Bearish on SP500
As we highlighted in last week’s video, two bearish monthly candles warn of a potential top, although whilst prices hold key support bulls are well within their rights to have another crack at the highs. And they may take comfort in the fact that the S&P500 has closed higher 63.3% of the time in October over the past 30 years, and this bullish bias increases to 73.3% and 76.7% for November and December.
We can see on the S&P500 daily chart that the gap has nearly closed and (so far) provided support. A potential corrective channel is forming, so bulls could take a break of the descending trendline as a signal prices are headed back towards their highs. Yet given the choppy nature of price action we’re also on guard for a break beneath the support zone. So we’ll continue to monitor S&P500 stocks for both long and short setups.
- For bullish setups on the index, we’d prefer to see the support zone hold and / or prices break above the retracement line. The all-time highs are the initial target, before keeping an open target if it break highs.
- A clear break beneath the support zone suggests we’re in for a deeper correction / part of a larger top. However, a minor close beneath support may not cut it, given the choppy nature of price action.
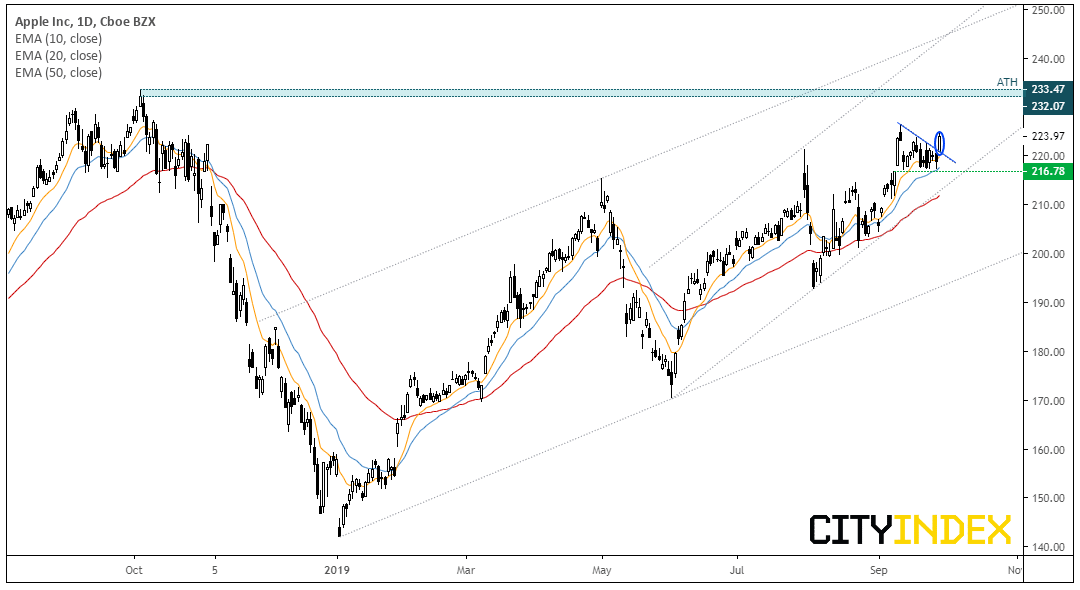
Apple has broken out of compression with a firm close above its retracement line. Two bullish channels remain in play and the stock is now accelerating away from the lower trendline of the internal channel. The 20-day eMA also provided support ahead of yesterday’s breakout.
- The near-term bias remains bullish above 216.78 support, or a break beneath yesterday’s low could also be used for a more aggrieve approach to risk management. There is also the lower channel to consider, but it becomes a question of reward to risk.
- Bulls can use the highs around 233 as a target but, given the overall trend structure, an open upside target could also be considered.
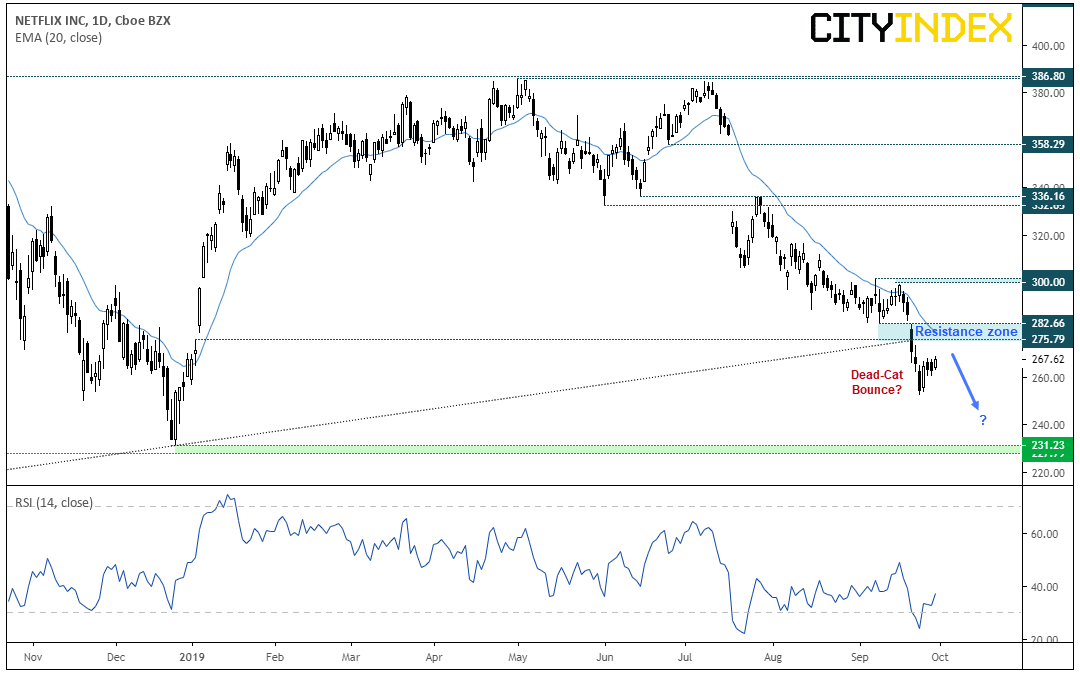
Netflix appears to be setting itself up for a dead cat bounce. Since the prior analysis, bears pushed the stock to a fresh YTD low which dragged RSI to oversold, yet price action remains firmly bearish. Yes, a slight bullish divergence with RSI has formed but a momentum low doesn’t always mark a price low. Besides, now prices are consolidating it allows time for RSI to recalibrate. And whilst resistance levels hold, bears aren’t likely to flee.
- The daily trend remains bearish below 300, although the zone around the broken trendline and 275.79 – 282.66 makes a tempting area for bears to fade into.
- For fading (shorting into a rising market, in this case) we’d want volatility to remain low. Keep in mind that without news to knock this lower, patterns such as dead cat bounces can go on for some time as they slowly grind higher. So, an earlier entry may require a wider stop.
- Alternatively, bears could wait for bearish momentum to return before assuming the dead cat bounce has completed, then use the 230 low as an initial target.
From time to time, StoneX Financial Pty Ltd (“we”, “our”) website may contain links to other sites and/or resources provided by third parties. These links and/or resources are provided for your information only and we have no control over the contents of those materials, and in no way endorse their content. Any analysis, opinion, commentary or research-based material on our website is for information and educational purposes only and is not, in any circumstances, intended to be an offer, recommendation or solicitation to buy or sell. You should always seek independent advice as to your suitability to speculate in any related markets and your ability to assume the associated risks, if you are at all unsure. No representation or warranty is made, express or implied, that the materials on our website are complete or accurate. We are not under any obligation to update any such material.
As such, we (and/or our associated companies) will not be responsible or liable for any loss or damage incurred by you or any third party arising out of, or in connection with, any use of the information on our website (other than with regards to any duty or liability that we are unable to limit or exclude by law or under the applicable regulatory system) and any such liability is hereby expressly disclaimed.
City Index is a trading name of StoneX Financial Pty Ltd.
The material provided herein is general in nature and does not take into account your objectives, financial situation or needs.
While every care has been taken in preparing this material, we do not provide any representation or warranty (express or implied) with respect to its completeness or accuracy. This is not an invitation or an offer to invest nor is it a recommendation to buy or sell investments.
StoneX recommends you to seek independent financial and legal advice before making any financial investment decision. Trading CFDs and FX on margin carries a higher level of risk, and may not be suitable for all investors. The possibility exists that you could lose more than your initial investment further CFD investors do not own or have any rights to the underlying assets.
It is important you consider our Financial Services Guide and Product Disclosure Statement (PDS) available at www.cityindex.com/en-au/terms-and-policies/, before deciding to acquire or hold our products. As a part of our market risk management, we may take the opposite side of your trade. Our Target Market Determination (TMD) is also available at www.cityindex.com/en-au/terms-and-policies/.
StoneX Financial Pty Ltd, Suite 28.01, 264 George Street, Sydney, NSW 2000 (ACN 141 774 727, AFSL 345646) is the CFD issuer and our products are traded off exchange.
© City Index 2024