is eurgbp about to drop 2690052017
Market participants looking for fireworks were left disappointed when the UK government officially started the process of leaving the EU on Wednesday. The pound has weakened a tad against the US dollar, but strengthened versus the euro and is holding its own relatively well against the yen. Meanwhile the FTSE 100 finds itself about 75 points shy of its March 17th record high level – hardly a disaster. To be fair, the UK stock index didn’t exactly fall off a cliff on the back of the Brexit vote back in June last year, as it was supported among other things by a corresponding slump in the pound and extremely accommodative monetary policy . So, even if negotiations between the UK and EU were to start going bad then it remains to be seen if the response from the FTSE will be any different this time, but it may haunt the pound. But now the focus is slowly turning away from Brexit to a potential Frexit with upcoming French elections in April. In the event that support for Marine Le Pen – the leader of the far right-wing National Front party – increases, so too will anxiety among market participants, and serious question marks will be raised about the future of the whole EU project. Given this uncertainty, the euro could come under pressure in the coming weeks and months. Consequently, the EUR/GBP may start to ease as speculators potentially reduce their record net short positions in GBP and increase their bearish bets on EUR. However the long-term outlook on GBP remains uncertain, so we are only expecting – at this stage – a moderate GBP recovery relative to EUR.
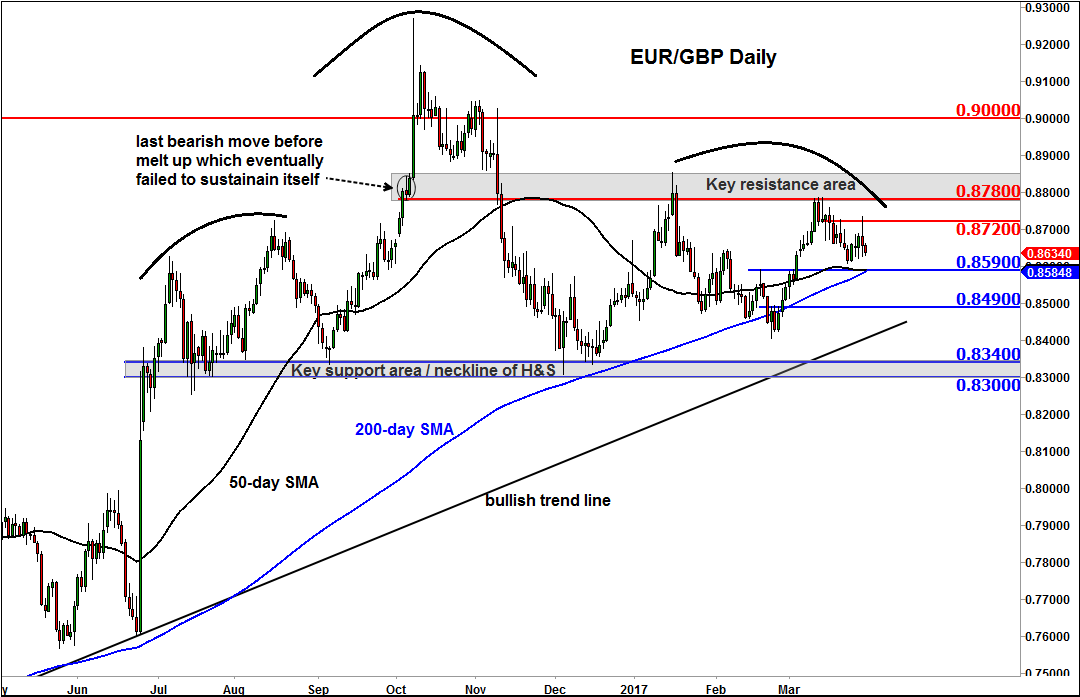
But from a technical perspective, the EUR/GBP may be in the process of forming a complex Head and Shoulders reversal formation, potentially pointing to a significant change in the tide. The cross has now failed twice to break the key resistance zone above the 0.8780 area, the second attempt resulting in a lower high. So it could be forming the right shoulder here. But the cross still remains well above the neckline and key support area of 0.8300-8340 and also above the still-rising 200-day moving average (0.8585/90), which objectively tells us that the long-term trend is still bullish. However will it now head decisively lower? To have any chance of doing that, it will first need to break below short-term support levels at 0.8590 and 0.8490, levels which were formerly resistance.
From time to time, StoneX Financial Pty Ltd (“we”, “our”) website may contain links to other sites and/or resources provided by third parties. These links and/or resources are provided for your information only and we have no control over the contents of those materials, and in no way endorse their content. Any analysis, opinion, commentary or research-based material on our website is for information and educational purposes only and is not, in any circumstances, intended to be an offer, recommendation or solicitation to buy or sell. You should always seek independent advice as to your suitability to speculate in any related markets and your ability to assume the associated risks, if you are at all unsure. No representation or warranty is made, express or implied, that the materials on our website are complete or accurate. We are not under any obligation to update any such material.
As such, we (and/or our associated companies) will not be responsible or liable for any loss or damage incurred by you or any third party arising out of, or in connection with, any use of the information on our website (other than with regards to any duty or liability that we are unable to limit or exclude by law or under the applicable regulatory system) and any such liability is hereby expressly disclaimed.
City Index is a trading name of StoneX Financial Pty Ltd.
The material provided herein is general in nature and does not take into account your objectives, financial situation or needs.
While every care has been taken in preparing this material, we do not provide any representation or warranty (express or implied) with respect to its completeness or accuracy. This is not an invitation or an offer to invest nor is it a recommendation to buy or sell investments.
StoneX recommends you to seek independent financial and legal advice before making any financial investment decision. Trading CFDs and FX on margin carries a higher level of risk, and may not be suitable for all investors. The possibility exists that you could lose more than your initial investment further CFD investors do not own or have any rights to the underlying assets.
It is important you consider our Financial Services Guide and Product Disclosure Statement (PDS) available at www.cityindex.com/en-au/terms-and-policies/, before deciding to acquire or hold our products. As a part of our market risk management, we may take the opposite side of your trade. Our Target Market Determination (TMD) is also available at www.cityindex.com/en-au/terms-and-policies/.
StoneX Financial Pty Ltd, Suite 28.01, 264 George Street, Sydney, NSW 2000 (ACN 141 774 727, AFSL 345646) is the CFD issuer and our products are traded off exchange.
© City Index 2024