Iranian retaliation begins SP500
In the first full trading week of 2020, a cautious mood looms over markets after the assassination of powerful Iranian commander Qassem Soleiman who once called President Trump a “gambler”.
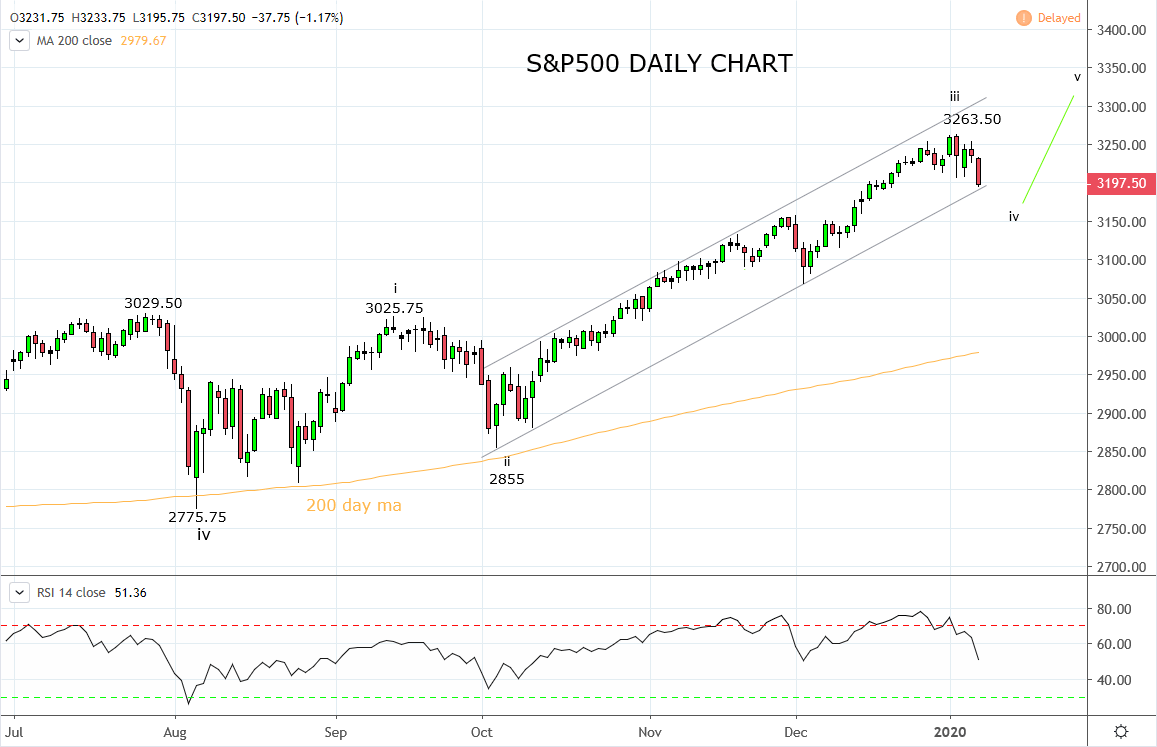
While most analysts don’t think the latest escalation in tensions between the U.S. and Iran will result in an actual military confrontation, reprisal attacks on American interests commenced this morning with an Iranian missile attack on a military base in Iraq hosting American troops. S&P 500 futures are currently down -1.2% at the time of writing, trading at 3197.50.
Last week’s drone attack is destined to have a more lingering impact than when he last rattled markets in early December. Back then, President Trump issued a barrage of tariff threats against Argentina, Brazil, China, France and NATO members whom he considered weren’t spending enough on defence.
Quick to respond, global equity markets sold off and news headlines predicted the end of the Santa stock market rally before it had even begun. We argued that the Santa rally would take place as usual in 2019, including a move towards 3200 for the S&P500 into year-end here.
This time around, due to ongoing uncertainty around the exact timing and nature of continued Iranian retaliation, investors are unlikely to be so quick to brush off President Trumps' latest roll of the dice. Additionally, the timing of the current S&P 500 pullback fits very well within our expectation for a pullback in early January as outlined in recent Week Ahead videos.
Technically, post the break to new highs in late October 2019, the S&P500 continued higher within an upward sloping trend channel. The current pullback is viewed as a minor Wave iv and is now testing the first level of support which comes from the lower bound of the trend channel 3190/85 area.
Below here, interim support resides 3155 area before medium-term support kicks in at 3070/50 area. With this in mind, dips towards the support regions mentioned above will be viewed as selective buying opportunities, in expectation of the uptrend resuming in February 2020 resulting in a test of 3350/3400.
Only a break and close below 3020/10 would be reason to reassess the bullish view.
Source Tradingview. The figures stated areas of the 8th of January 2020. Past performance is not a reliable indicator of future performance. This report does not contain and is not to be taken as containing any financial product advice or financial product recommendation
From time to time, StoneX Financial Pty Ltd (“we”, “our”) website may contain links to other sites and/or resources provided by third parties. These links and/or resources are provided for your information only and we have no control over the contents of those materials, and in no way endorse their content. Any analysis, opinion, commentary or research-based material on our website is for information and educational purposes only and is not, in any circumstances, intended to be an offer, recommendation or solicitation to buy or sell. You should always seek independent advice as to your suitability to speculate in any related markets and your ability to assume the associated risks, if you are at all unsure. No representation or warranty is made, express or implied, that the materials on our website are complete or accurate. We are not under any obligation to update any such material.
As such, we (and/or our associated companies) will not be responsible or liable for any loss or damage incurred by you or any third party arising out of, or in connection with, any use of the information on our website (other than with regards to any duty or liability that we are unable to limit or exclude by law or under the applicable regulatory system) and any such liability is hereby expressly disclaimed.
City Index is a trading name of StoneX Financial Pty Ltd.
The material provided herein is general in nature and does not take into account your objectives, financial situation or needs.
While every care has been taken in preparing this material, we do not provide any representation or warranty (express or implied) with respect to its completeness or accuracy. This is not an invitation or an offer to invest nor is it a recommendation to buy or sell investments.
StoneX recommends you to seek independent financial and legal advice before making any financial investment decision. Trading CFDs and FX on margin carries a higher level of risk, and may not be suitable for all investors. The possibility exists that you could lose more than your initial investment further CFD investors do not own or have any rights to the underlying assets.
It is important you consider our Financial Services Guide and Product Disclosure Statement (PDS) available at www.cityindex.com/en-au/terms-and-policies/, before deciding to acquire or hold our products. As a part of our market risk management, we may take the opposite side of your trade. Our Target Market Determination (TMD) is also available at www.cityindex.com/en-au/terms-and-policies/.
StoneX Financial Pty Ltd, Suite 28.01, 264 George Street, Sydney, NSW 2000 (ACN 141 774 727, AFSL 345646) is the CFD issuer and our products are traded off exchange.
© City Index 2024