Historically How Bearish Has A Bearish Outside Week Been On The ASX200
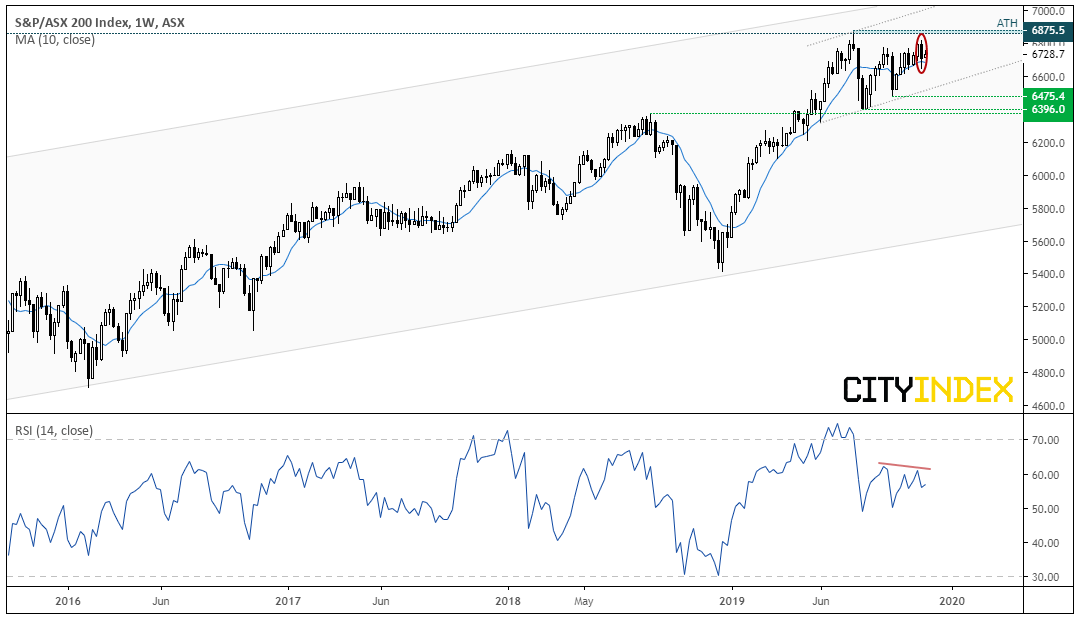
By Friday’s close, the ASX200 had produced a bearish outside week after failing to hold above 6,800 which raises the potential for some mean reversion. Given the slight bearish divergence forming with RSI and the clear loss of momentum leading it back towards its all-time high, we explore the bearish potential of this classic candlestick pattern to see if it can pull the rug from under Santa’s rally in December.
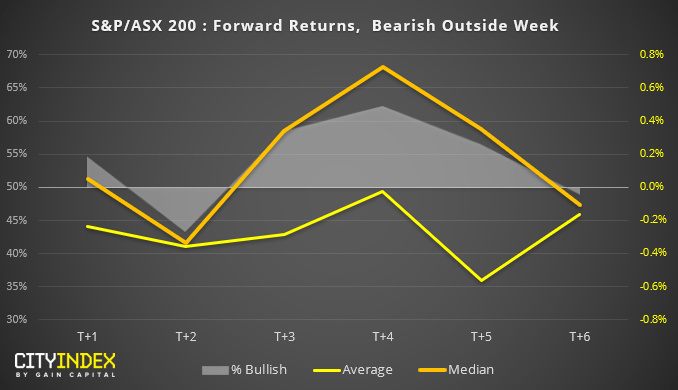
The test: Using Reuters data since April 2000, we filtered all bearish outside candles on the weekly chart. We have then calculated forward returns following a bearish outside candle, along with the % of bullish closes of the forward returns.
As we’re testing a bearish pattern, ideally we’d want to see negative returns with a % bullish rate below 50%.
- The week following a bearish outside candle tends to close higher more often than not and median returns are also positive, whilst average returns are negative (currently the ASX200 is trading higher this week but we’ll see how this plays out).
- From this data set, 2 weeks after a bearish outside week has produced the most bearish average and median returns, with the highest success rate (as they only close higher on 43.4% of the times). Also note that median returns are also negative suggesting the results are more consistent. Whilst average returns are larger 5 weeks out, it clearly diverges with median returns to show that outliers have weighed this average down.
- Whilst average returns are negative between 1-6 weeks after the pattern, median returns (or typical returns) are positive and close higher over 50% of the time. This suggests a few outliers have pushed average returns into negative territory, yet they typically close higher more often than not.
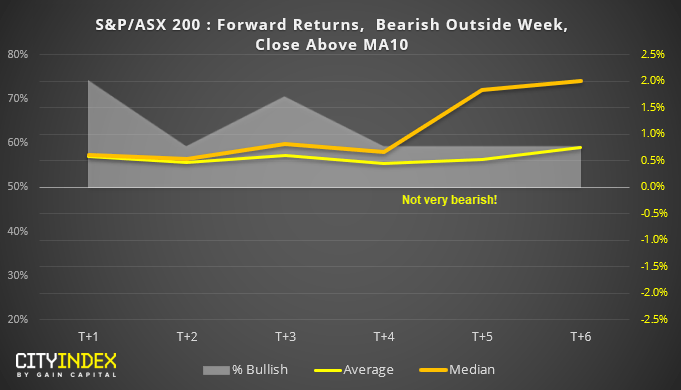
However, as this filters all bearish outside candles, trend direction has not been considered. So next we apply a rule where the pattern must close above or below its 10-week average to denote a basic trend filter.
Bearish outside day with a close above its 10-week MA
- In short, not very bearish at all.
- Average and median returns are positive between 1 to 6 weeks later, and all have a positive expectancy with % bullish above zero.
- It’s interesting to note that median returns accelerate 5-6 weeks later
- The week after the pattern (or this week) has a % bullish rate of 75%!
- However, there are only 27 instances of this occurring since 2000 (generally its good practice to have a minimum of 30 occurrences).
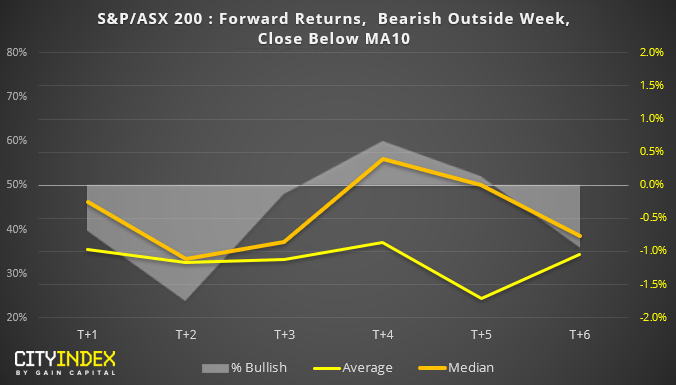
Bearish outside day with a close below its 10-week MA
- That’s a bit more like it…
- Again we see +2 weeks as optimal to bears, as both average and median returns are bearish. Moreover, bullish closes are just 24% which means it has closed lower 76% of the time.
- The relationship breaks down around 4 weeks later as median returns are positive over 50% of the time.
- Ultimately, it has been better at picking near-term reversals over longer-term ones.
- However, there are only 25 instances of this occurring since 2000 which is below the ideal sample of 30 or above.
Final thoughts:
- Two weeks after a bearish engulfing candle appears optimum for bears, unless it has closed above its 10-week MA. (take note, the ASX200 closed above its 10-week MA last week).
- Moreover, with average, median and % of bullish closes all positive up to 6 weeks after the bearish outside week closes above its 10-week MA, it appears to be more of a bear-trap signal if anything.
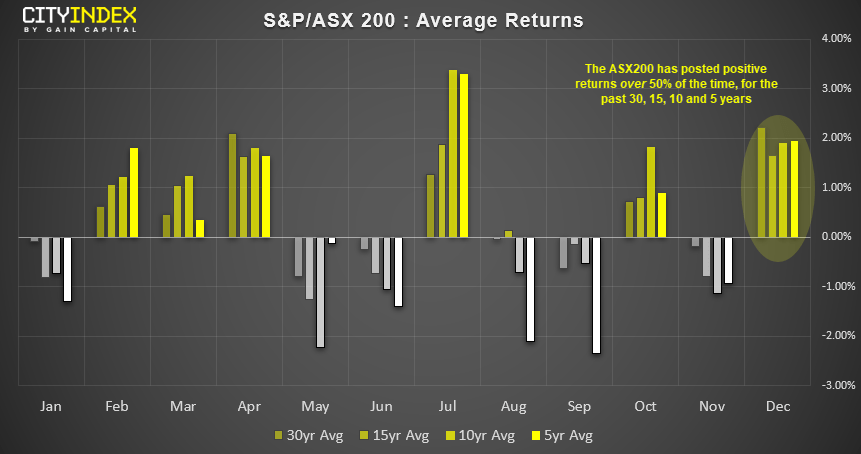
- Moreover, December has historically been the most bullish month of the year for the ASX200. Average returns are over 2% over the past 30 years, and it has also posted positive average returns over 50% of the time over the past 30, 15, 10 and 5 years.
- Given its tendency to rally in December and post positive returns if a bearish engulfing candle closes above its 10-week average, the ASX200 could still rally over the next few weeks.
Related Analysis (City Index):
ASX200: The Long And Short Of It | NAN, GXY, REA, BPT
Weekly and Monthly Bearish Engulfing Candles Appear On DXY - But Just How Grizzly Are They?
How WTI Has Traded Following Bullish Spikes Of The Past
Forward Returns Following A US10-2 Year Inversion
Bitcoin: Do Volatile Bullish Sessions Lead To Further Gains?
From time to time, StoneX Financial Pty Ltd (“we”, “our”) website may contain links to other sites and/or resources provided by third parties. These links and/or resources are provided for your information only and we have no control over the contents of those materials, and in no way endorse their content. Any analysis, opinion, commentary or research-based material on our website is for information and educational purposes only and is not, in any circumstances, intended to be an offer, recommendation or solicitation to buy or sell. You should always seek independent advice as to your suitability to speculate in any related markets and your ability to assume the associated risks, if you are at all unsure. No representation or warranty is made, express or implied, that the materials on our website are complete or accurate. We are not under any obligation to update any such material.
As such, we (and/or our associated companies) will not be responsible or liable for any loss or damage incurred by you or any third party arising out of, or in connection with, any use of the information on our website (other than with regards to any duty or liability that we are unable to limit or exclude by law or under the applicable regulatory system) and any such liability is hereby expressly disclaimed.
City Index is a trading name of StoneX Financial Pty Ltd.
The material provided herein is general in nature and does not take into account your objectives, financial situation or needs.
While every care has been taken in preparing this material, we do not provide any representation or warranty (express or implied) with respect to its completeness or accuracy. This is not an invitation or an offer to invest nor is it a recommendation to buy or sell investments.
StoneX recommends you to seek independent financial and legal advice before making any financial investment decision. Trading CFDs and FX on margin carries a higher level of risk, and may not be suitable for all investors. The possibility exists that you could lose more than your initial investment further CFD investors do not own or have any rights to the underlying assets.
It is important you consider our Financial Services Guide and Product Disclosure Statement (PDS) available at www.cityindex.com/en-au/terms-and-policies/, before deciding to acquire or hold our products. As a part of our market risk management, we may take the opposite side of your trade. Our Target Market Determination (TMD) is also available at www.cityindex.com/en-au/terms-and-policies/.
StoneX Financial Pty Ltd, Suite 28.01, 264 George Street, Sydney, NSW 2000 (ACN 141 774 727, AFSL 345646) is the CFD issuer and our products are traded off exchange.
© City Index 2024