Goldman Sachs a laggard is breaking out finally
Medium-term technical outlook on Goldman Sachs (GS)
click to enlarge charts
Key Levels (1 to 3 weeks)
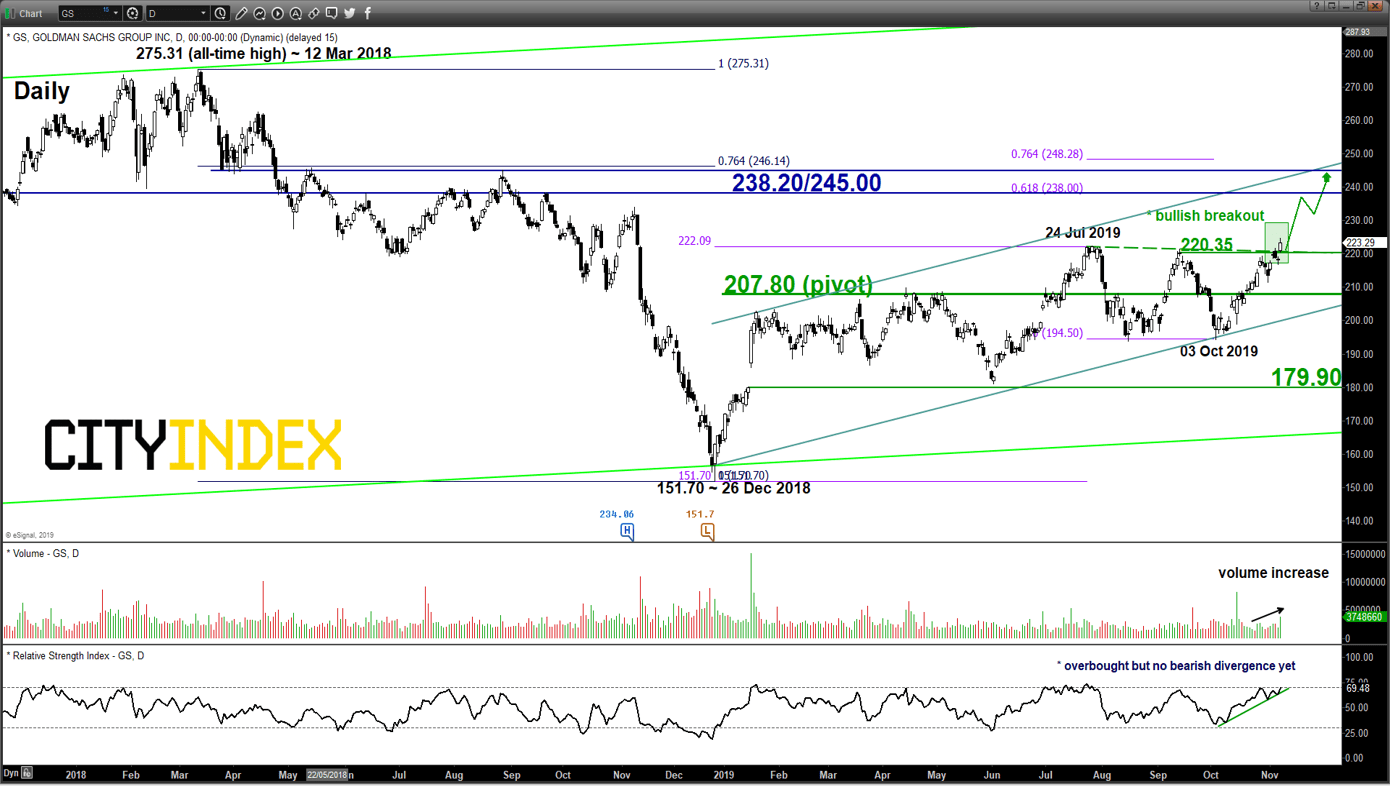
Intermediate support: 220.35
Pivot (key support): 207.80
Resistances: 238.20 & 245.00
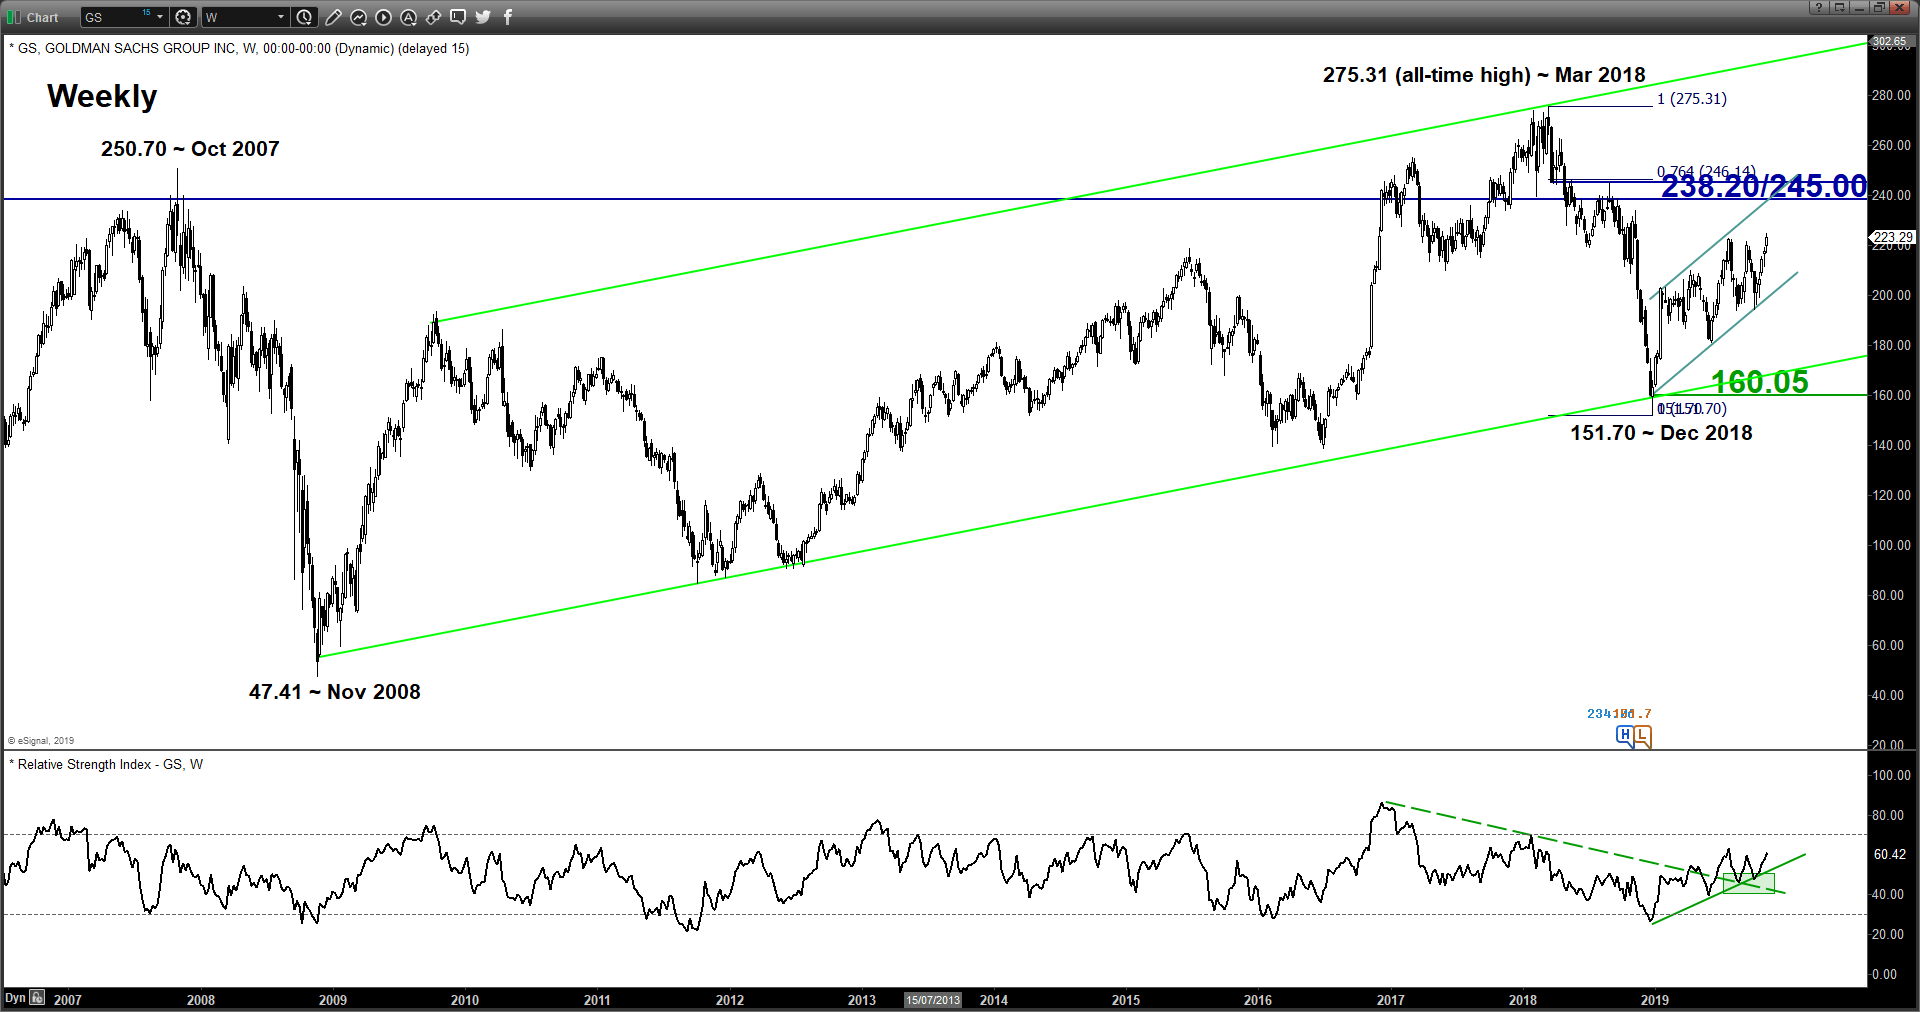
Next supports: 179.90 & 160.05
Directional Bias (1 to 3 weeks)
Bullish bias above 207.80 key medium-term pivotal support for a further potential upleg to target the next resistances at 238.20 follow by 245.00 next.
However, a break with a daily close below 207.80 invalidates the bullish scenario for another round of corrective decline sequence within its long-term secular uptrend phase in place since Nov 2008 low for a drop towards the next support at 179.90 (the swing low area of 03 Jun 2019 & 61.8% Fibonacci retracement of the up move from 26 Dec 2018 low to 07 Nov 2019 high).
Key elements
- GS has staged a bullish breakout yesterday, 08 Nov from a 3-month sideways range configuration in place since 24 Jul 2019 high with a relatively high-volume reading.
- The weekly & daily RSI oscillators have continued to evolve in positive configurations which suggest medium-term upside medium remains intact.
- The significant medium-term resistance zone of 238.20/245.00 is defined by a swing high area of 14 May/28 Aug 2018, a Fibonacci retracement/expansion cluster and the upper boundary of a major ascending channel from 26 Dec 2018 low).
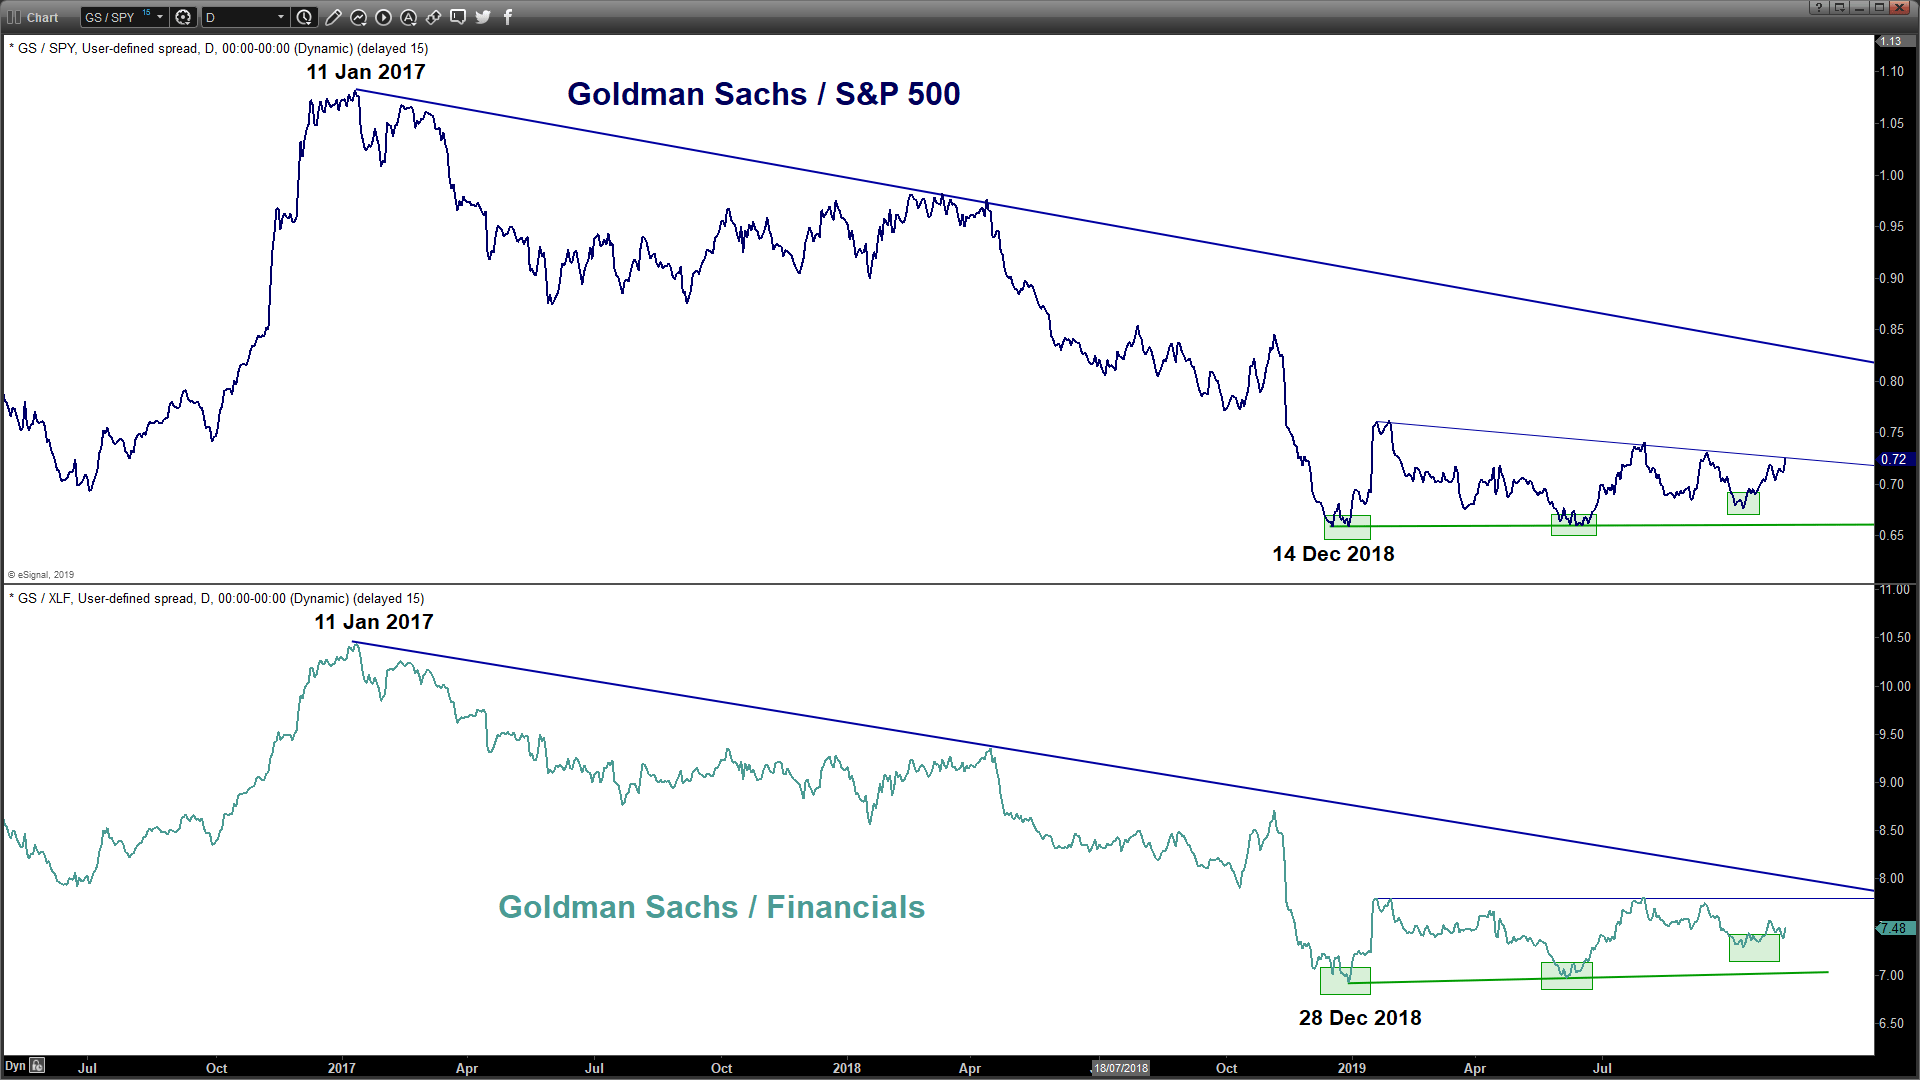
- Relative strength analysis from the ratio charts of GS against the market (S&P 500) and its sector (Financials) are showing “bottoming” formations. These observations suggest an impending potential outperformance of GS after underperforming both the S&P 500 and Financials sector for almost 10 months.
Charts are from eSignal
From time to time, StoneX Financial Pty Ltd (“we”, “our”) website may contain links to other sites and/or resources provided by third parties. These links and/or resources are provided for your information only and we have no control over the contents of those materials, and in no way endorse their content. Any analysis, opinion, commentary or research-based material on our website is for information and educational purposes only and is not, in any circumstances, intended to be an offer, recommendation or solicitation to buy or sell. You should always seek independent advice as to your suitability to speculate in any related markets and your ability to assume the associated risks, if you are at all unsure. No representation or warranty is made, express or implied, that the materials on our website are complete or accurate. We are not under any obligation to update any such material.
As such, we (and/or our associated companies) will not be responsible or liable for any loss or damage incurred by you or any third party arising out of, or in connection with, any use of the information on our website (other than with regards to any duty or liability that we are unable to limit or exclude by law or under the applicable regulatory system) and any such liability is hereby expressly disclaimed.
City Index is a trading name of StoneX Financial Pty Ltd.
The material provided herein is general in nature and does not take into account your objectives, financial situation or needs.
While every care has been taken in preparing this material, we do not provide any representation or warranty (express or implied) with respect to its completeness or accuracy. This is not an invitation or an offer to invest nor is it a recommendation to buy or sell investments.
StoneX recommends you to seek independent financial and legal advice before making any financial investment decision. Trading CFDs and FX on margin carries a higher level of risk, and may not be suitable for all investors. The possibility exists that you could lose more than your initial investment further CFD investors do not own or have any rights to the underlying assets.
It is important you consider our Financial Services Guide and Product Disclosure Statement (PDS) available at www.cityindex.com/en-au/terms-and-policies/, before deciding to acquire or hold our products. As a part of our market risk management, we may take the opposite side of your trade. Our Target Market Determination (TMD) is also available at www.cityindex.com/en-au/terms-and-policies/.
StoneX Financial Pty Ltd, Suite 28.01, 264 George Street, Sydney, NSW 2000 (ACN 141 774 727, AFSL 345646) is the CFD issuer and our products are traded off exchange.
© City Index 2024