gold will dovish fomc minutes inspire metal to rally 2657092016
After a quiet start, the FX markets turned volatile this afternoon as traders sold the dollar in anticipation that the imminent release of the FOMC’s last meeting minutes will confirm the recent dovish commentary from the Fed. In addition, oil prices surged higher on the back of the latest weekly crude stockpiles report from the US Department of Energy. Although this was a mixed-bag report as it showed stocks at Cushing and those of oil products increased, the big headline drawdown of 4.9 million barrels exceeded both expectations and the American Petroleum Institute’s (API) estimate from last night. Consequently, oil, which was already up on the API data, extended its gains and lifted energy stocks with it. More gains for oil could be on the way if further evidence emerges that suggest US oil output will fall noticeably later this year, and if the OPEC and Russia manage to agree on a production freeze later this month.
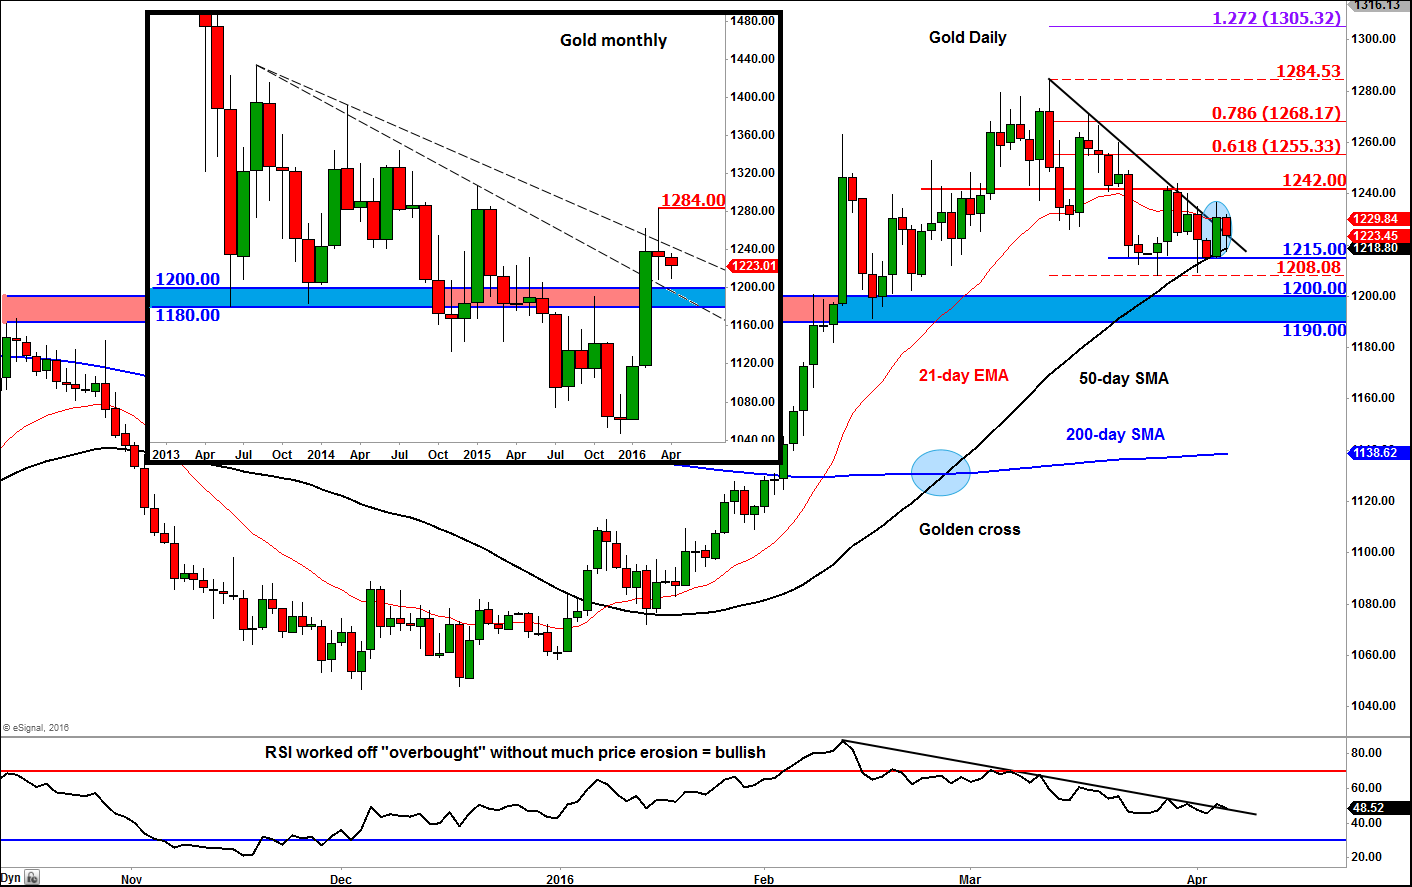
Today’s risk on” rally for oil and stocks meant that the safe haven and buck-denominated gold, which does not yield any interest, was unable to find further support from the weakness in US dollar. But this could change, of course, should the FOMC minutes convey a more dovish message than expected. Ahead of the publication of the FOMC minutes, gold was trading a touch lower on the day. Yesterday, the precious metal found strong support at around the $1215/18 area. As can be seen on the daily chart, below, this area was previously support and corresponds with the rising 50-day moving average. So it remains to be seen whether this was a merely dead-cat bounce or the resumption point of the rally.
Thus, today’s close will be very important for gold, for a rally above yesterday’s high would confirm the break of the short-term bearish trend, potentially paving the way for more gains later in the week. However a break below the aforementioned support region could pave the way for a move towards the more significant support at $1200 or even $1190. But the longer-term technical outlook on gold still looks supportive. The daily moving averages, for example, are all in the correct order, while the RSI has worked off “overbought” conditions without significant price erosion. This means that the next leg of the rally could last for several days before the RSI signals overbought again.
Meanwhile the monthly chart in the inset shows gold has cleared the long-term support and resistance area between $1180 and $1200. It has also taken out one of the two bearish trend lines. However, the rally came to a halt last month and the metal formed a doji-looking candle. So, on this time frame, it will need to climb above the March high at $1284 in order to boost the confidence of long-term investors. While below this level, gold bugs will need to be wary of the possibility for a deeper pullback, perhaps towards the 200-day moving, before gold potentially resumes its rally.
From time to time, StoneX Financial Pty Ltd (“we”, “our”) website may contain links to other sites and/or resources provided by third parties. These links and/or resources are provided for your information only and we have no control over the contents of those materials, and in no way endorse their content. Any analysis, opinion, commentary or research-based material on our website is for information and educational purposes only and is not, in any circumstances, intended to be an offer, recommendation or solicitation to buy or sell. You should always seek independent advice as to your suitability to speculate in any related markets and your ability to assume the associated risks, if you are at all unsure. No representation or warranty is made, express or implied, that the materials on our website are complete or accurate. We are not under any obligation to update any such material.
As such, we (and/or our associated companies) will not be responsible or liable for any loss or damage incurred by you or any third party arising out of, or in connection with, any use of the information on our website (other than with regards to any duty or liability that we are unable to limit or exclude by law or under the applicable regulatory system) and any such liability is hereby expressly disclaimed.
City Index is a trading name of StoneX Financial Pty Ltd.
The material provided herein is general in nature and does not take into account your objectives, financial situation or needs.
While every care has been taken in preparing this material, we do not provide any representation or warranty (express or implied) with respect to its completeness or accuracy. This is not an invitation or an offer to invest nor is it a recommendation to buy or sell investments.
StoneX recommends you to seek independent financial and legal advice before making any financial investment decision. Trading CFDs and FX on margin carries a higher level of risk, and may not be suitable for all investors. The possibility exists that you could lose more than your initial investment further CFD investors do not own or have any rights to the underlying assets.
It is important you consider our Financial Services Guide and Product Disclosure Statement (PDS) available at www.cityindex.com/en-au/terms-and-policies/, before deciding to acquire or hold our products. As a part of our market risk management, we may take the opposite side of your trade. Our Target Market Determination (TMD) is also available at www.cityindex.com/en-au/terms-and-policies/.
StoneX Financial Pty Ltd, Suite 28.01, 264 George Street, Sydney, NSW 2000 (ACN 141 774 727, AFSL 345646) is the CFD issuer and our products are traded off exchange.
© City Index 2024