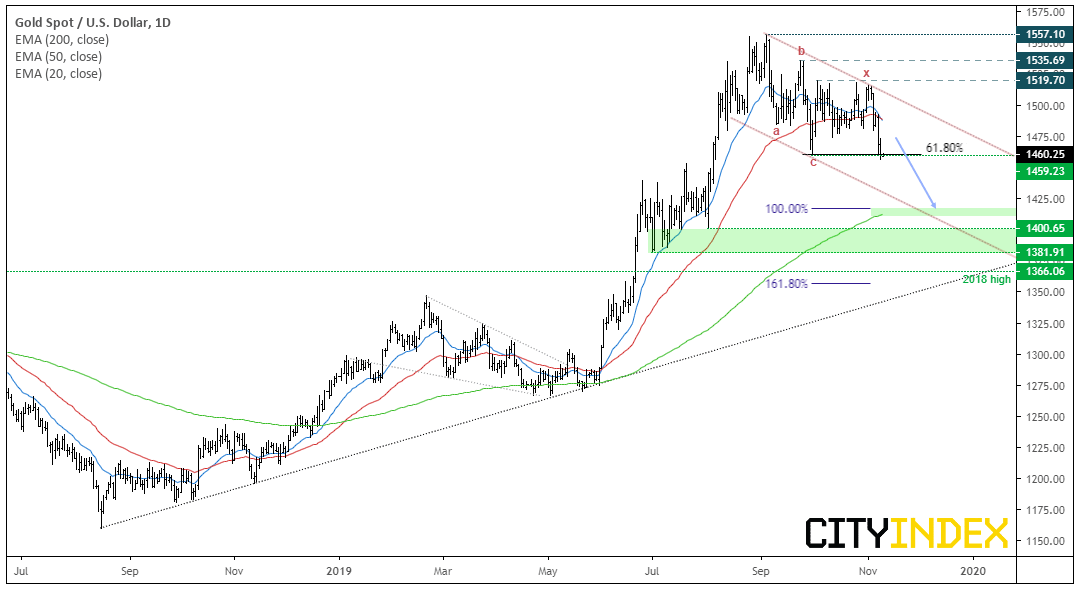
Gold Perks Up But Its Not Out Of The Woods
Overall, gold has a decent chance of breaking to new highs over the coming month/s. Yet whether is opts for direct gains or morphs into a prolonged, complex correction could become clear over the next week.
The breakout from the bearish/corrective channel on Friday threw a spanner in the works with its bearish pinbar. Whilst this warned of a bull-trap, bears struggled to push it lower this week we’ve seen another higher low. Whilst this suggests there’s demand around the 1475-1480 area, it’s touch and go as to whether prices can lift off from here.
Technically, there’s two variations of a bullish scenario would could play out. The former requires direct gains, the other could see the correction drag out before the rally truly resumes.
- We’ve seen the end an ABC correction at 1459, and a break above 1520 assumes we’re in wave 3 of an impulsive move (which should break to new high). However, we’d need to see bullish momentum return soon and exhibit a directional move associated with a wave 3
- Or… we’re still in a complex correction, and the initial ABC move which terminated at 1459 is the first zig-zag of a larger, corrective pattern. This scenario becomes more likely if any break higher fizzles out and retreats lower once more.
Vaneck Vectors Gold ETF CFD/DFT:
Still, whilst we wait for spot god to make up its mind, we’re also tracking a potentially bullish move on GDX (gold miners index). Prices have recently broken out of a bullish wedge formation (a continuation pattern in an uptrend) and on the cusp of testing key resistance at 28.35. If successful, the pattern projects an initial target around the highs near 31.
- Bulls could look for a break above 28.35 to assumes a run towards 30.36.
- Alternatively, if prices reverse (presumably) with gold, then a break of key support around 26 could provide an equally compelling short signal to bears.
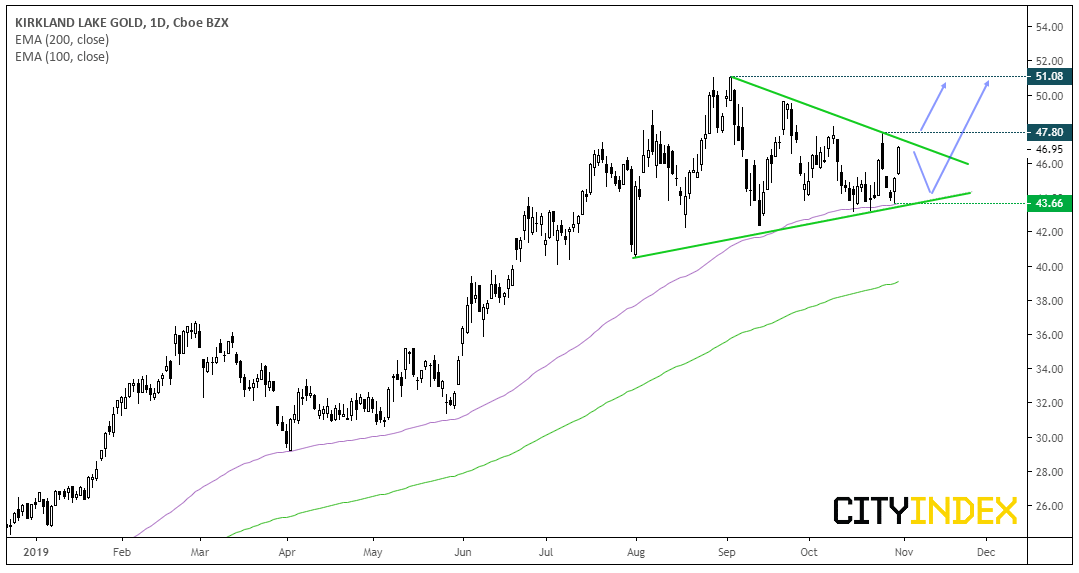
Kirkland Lake Gold CFD/DTF:
A tidy correction has seen prices respect the 100-day eMA and compress within a symmetrical triangle formation. Given this is typically a continuation pattern, shows a bullish trend structure is and the 2nd best performer YTD from the top-10 GDX constituents, our bias is for a bullish breakout.
- Bulls could either wait for a break or daily close above the descending trendline. For added confirmation, wait for a break/close above 47.80.
- Initial target is the 51.08 high but, due to the overall strength of the trend, we anticipate it to break to new highs if gold’s rally resumes.
- If gold struggles to break higher, we could see compression tighten further within the triangle. Unless of course gold rolls over, then it could spoil this otherwise textbook technical setup.
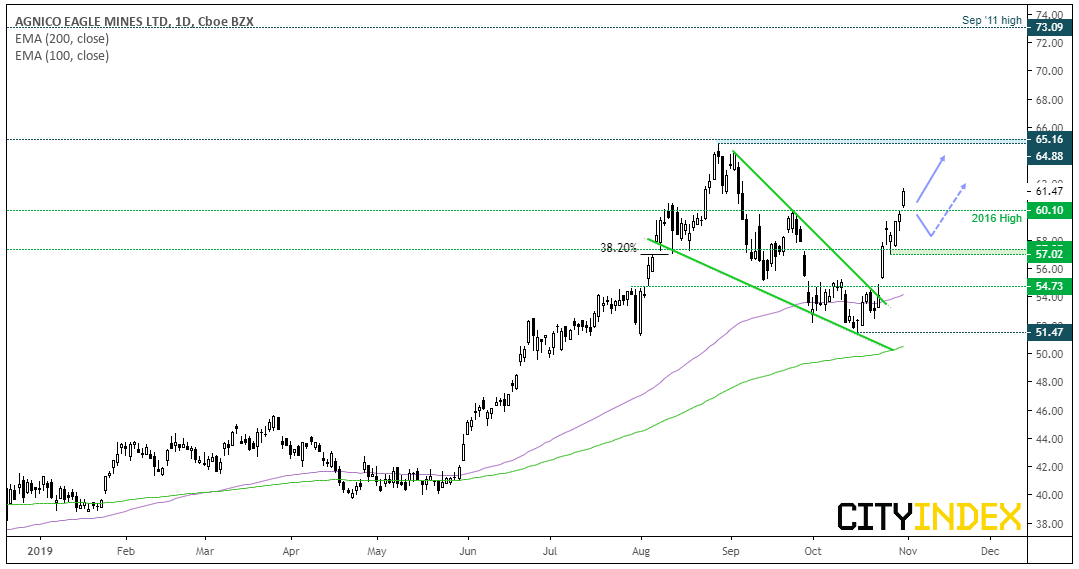
Agnico-Eagle Mines CFD/DTF:
Strong earnings last week saw prices gap higher out of a bullish wedge pattern. If successful, the pattern projects an approximate target around the base of the pattern at 64.88. And if gold is to break to new highs then perhaps a run towards 70 and 73 are on the cards (the Sep ’11 high). For now, momentum remains strong and support levels are nearby at 60 and 57.
- Momentum traders could seek bullish setups on intraday timeframes.
- If trading the daily chart, bulls could seek to buy dips around the 60 and 57 support levels.
- The daily trend remains bullish above the 51.47 low, yet we wouldn’t be seeking to buy sips if prices retrace to such a level. So we’d probably step aside if it broken beneath 57.
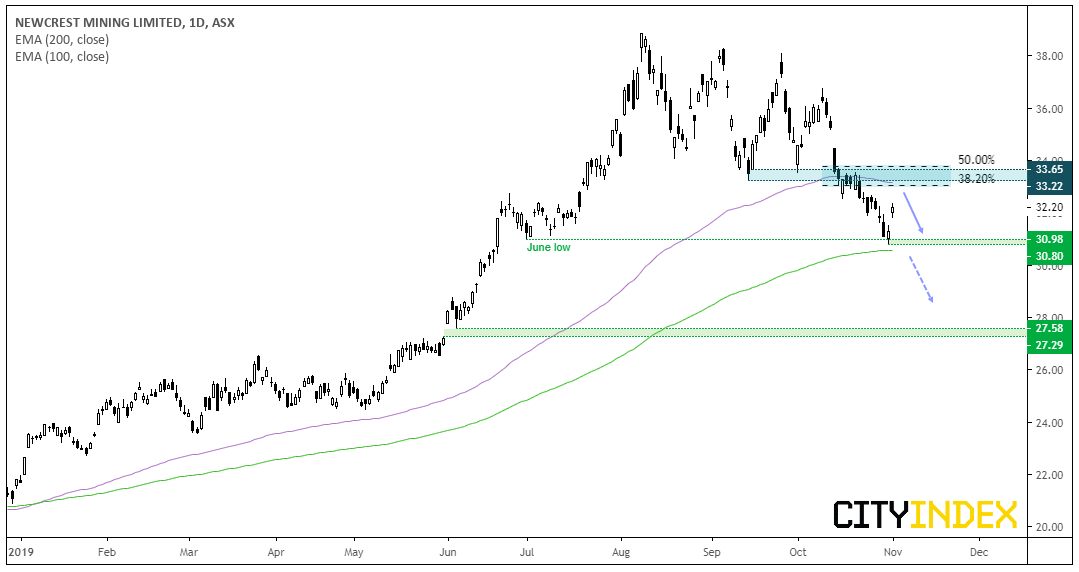
Newcrest Mining Limited CFD:
Newcrest is one to consider if the lust for gold fizzles out. Since its August peak, price action became erratic and choppy which itself can be the clues for a top. In mid-October, bears drove it beneath 32 into a small bearish flag before breaking beneath the 100-day eMA and heading for the June lows. Whilst the 200-day eMA is holding as support, momentum favours the bear-camp and a bearish trend structure.
- The bias remains bearish whilst prices trade below the 32-34 resistance zone, therefor the current bounce is assumed to be corrective
- Bears can fade into rallies beneath the resistance zone, assuming an eventual break to new low.
- Alternatively, wait for a break below 30; as this will invalidate the 200-day eMA and take it to a fresh cycle low
From time to time, StoneX Financial Pty Ltd (“we”, “our”) website may contain links to other sites and/or resources provided by third parties. These links and/or resources are provided for your information only and we have no control over the contents of those materials, and in no way endorse their content. Any analysis, opinion, commentary or research-based material on our website is for information and educational purposes only and is not, in any circumstances, intended to be an offer, recommendation or solicitation to buy or sell. You should always seek independent advice as to your suitability to speculate in any related markets and your ability to assume the associated risks, if you are at all unsure. No representation or warranty is made, express or implied, that the materials on our website are complete or accurate. We are not under any obligation to update any such material.
As such, we (and/or our associated companies) will not be responsible or liable for any loss or damage incurred by you or any third party arising out of, or in connection with, any use of the information on our website (other than with regards to any duty or liability that we are unable to limit or exclude by law or under the applicable regulatory system) and any such liability is hereby expressly disclaimed.
City Index is a trading name of StoneX Financial Pty Ltd.
The material provided herein is general in nature and does not take into account your objectives, financial situation or needs.
While every care has been taken in preparing this material, we do not provide any representation or warranty (express or implied) with respect to its completeness or accuracy. This is not an invitation or an offer to invest nor is it a recommendation to buy or sell investments.
StoneX recommends you to seek independent financial and legal advice before making any financial investment decision. Trading CFDs and FX on margin carries a higher level of risk, and may not be suitable for all investors. The possibility exists that you could lose more than your initial investment further CFD investors do not own or have any rights to the underlying assets.
It is important you consider our Financial Services Guide and Product Disclosure Statement (PDS) available at www.cityindex.com/en-au/terms-and-policies/, before deciding to acquire or hold our products. As a part of our market risk management, we may take the opposite side of your trade. Our Target Market Determination (TMD) is also available at www.cityindex.com/en-au/terms-and-policies/.
StoneX Financial Pty Ltd, Suite 28.01, 264 George Street, Sydney, NSW 2000 (ACN 141 774 727, AFSL 345646) is the CFD issuer and our products are traded off exchange.
© City Index 2024