Glencore cobalt drag will linger
The miner and commodity trader has gone back in the good-old-bad-old days on a failed cobalt bet
Overview
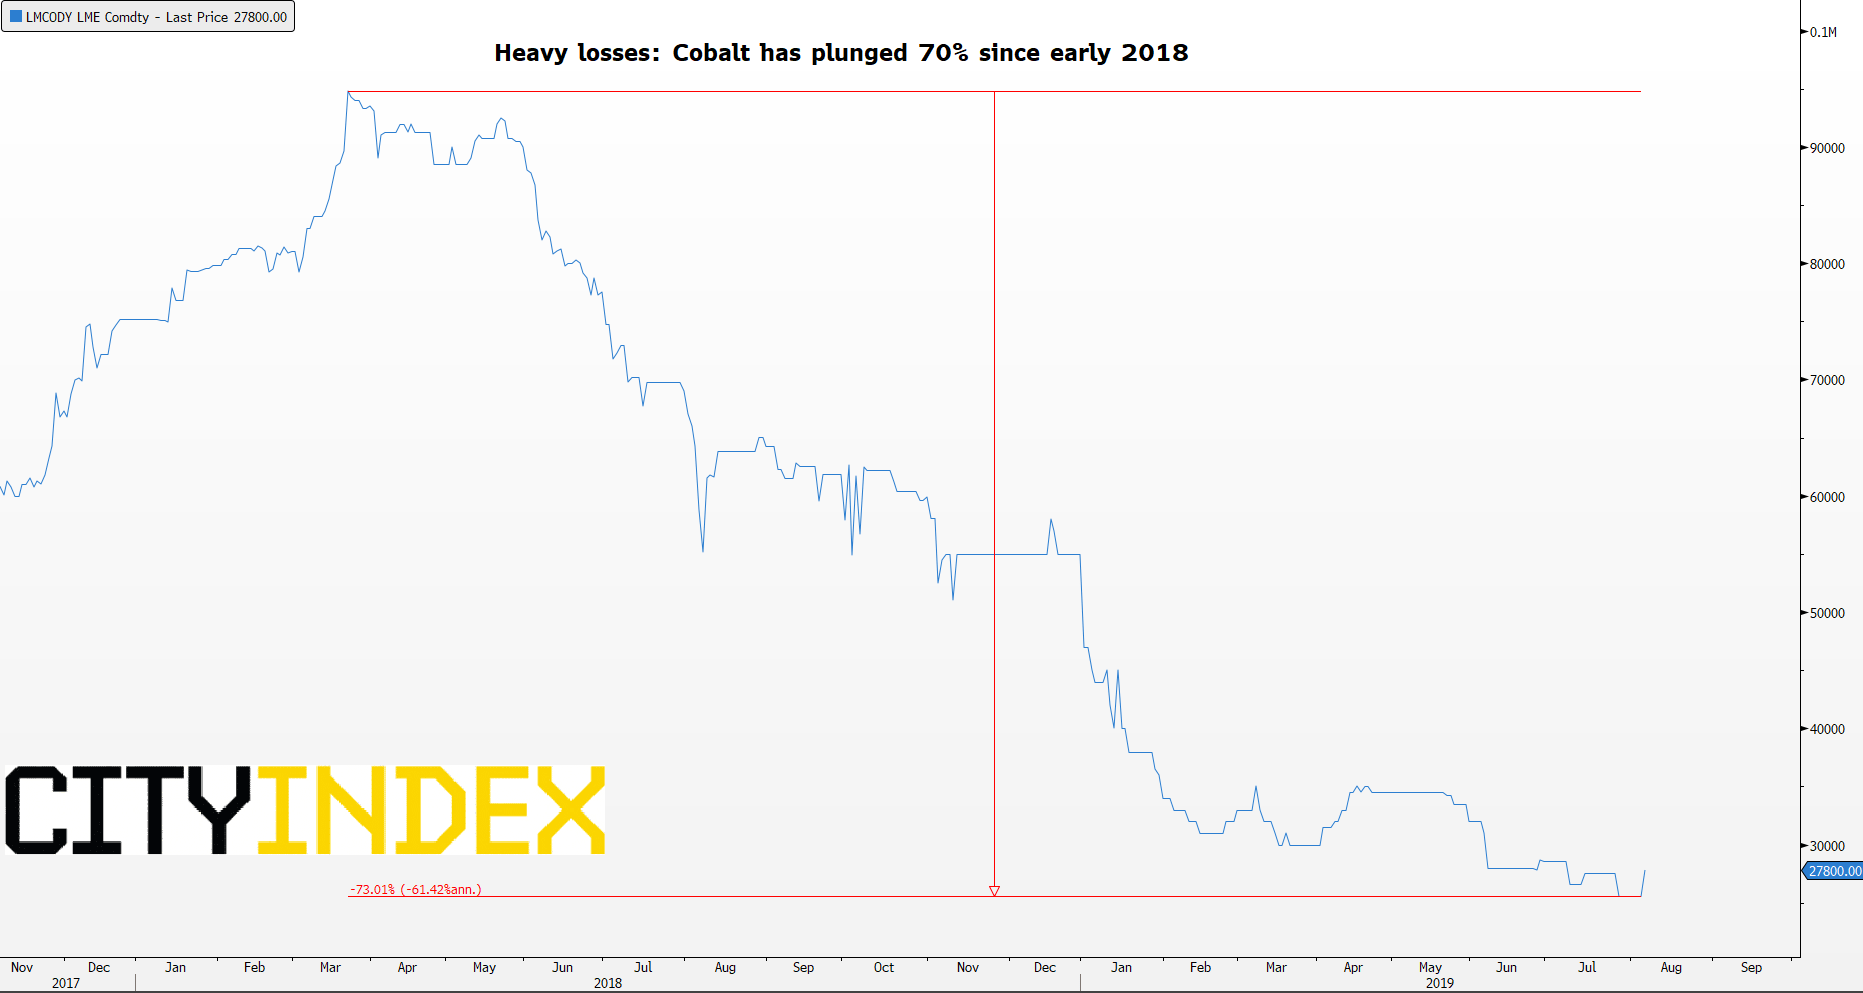
The hole Glencore has dug for itself of late is hardly a mystery. It has been at the heart of the production of Cobalt, used in electric vehicle batteries, since it began buying stakes in the Mutanda mine in Congo, 12 years ago. More than two thirds of global Cobalt production is mined there, making Glencore the world’s biggest producer. Alas, prices have crashed 70% from inflated heights since March 2018 as a frenzy of buying on shortage fears proved misguided when supply outstripped demand. As a result, the group will shutter production this year at a cost of $300m. Glencore’s profit collapse is just its latest headache. It also faces total fines of as much as $8bn related to corruption probes by the U.S. Department of Justice and other global regulators. And partly due to an over emphasis on Cobalt, the group has missed out on an iron-ore rally that buoys profits and shares of its FTSE rivals. Unsurprisingly, Glencore sharply underperforms the FTSE 350 mining index with a 22% slide this year.
LME Cobalt – daily March 2018 to date
Source: Bloomberg/City Index
H1 financial highlights: (Consensus forecasts published by Glencore)
- Adj. Ebitda: $5.58bn down 32% year-on-year, vs. $5.94bn expected
- Net income: $226m, down 92%, mostly on cobalt and impairment charges linked to African oil and copper businesses
- EBIT: $2.23bn vs. $2.36bn expected
- Net debt: $16.3bn vs. $14.781bn at H1 2018
Trading
Glencore’s ‘Marketing adjusted’ Ebitda fell 29% to $1.08bn, with a $350m loss from unsold cobalt. Excluding the “involuntary” long position in the metal, Glencore’s trading revenues still fell 13%.
Buyback
Despite its woes and rising debt, the group appears to have calculated that stock price weakness would be worse if it wasn’t so generous with cash surpluses. Glencore is sticking with a target to buy back $2bn of stock this year. It has $900m to go.
Outlook
CEO Ivan Glasenberg remains “confident that our commodity basket’s fundamentals will move in our favour”. The group is thereby staying laser-focused on Africa, where it has “identified a credible roadmap towards delivering on the significant cashflow generation potential”. For sure, cash generated from operation was a robust $5.4bn in H1, albeit down 21%. But net cash also fell, standing at $1.83bn from $2.2bn in H1 2018. Net debt has edged up to the upper end of the group’s target range. Net debt now outstrips Glencore’s underlying earnings by 2.3 times, the worst ratio among FTSE rivals.
Takeaway
In short, Glencore has gone back to the good-old-bad-old days, just a few short years after getting back in shape following the 2014-2015 commodity price collapse. Its optimism on the outlook is out of step with rising concerns on commodity demand and the U.S.-China trade war, which shows little sign of calming. Glencore shares may well turn out to be a leading indicator for the sector, but its own challenges suggest further downside is inevitable over the remainder of the year.
Chart thoughts
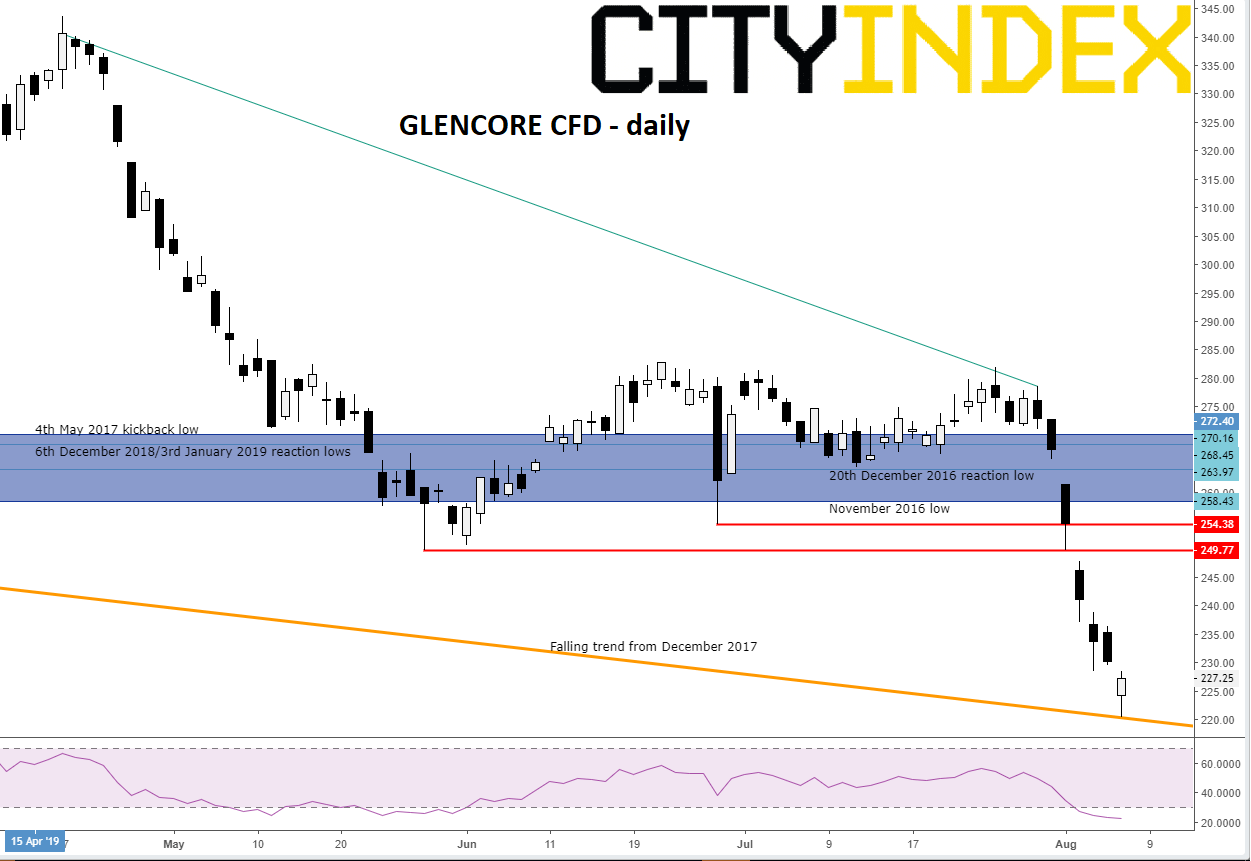
GLEN’s steady decline along a clean falling trend since late 2017 accelerated sharply in April in line with deteriorating cobalt prices. The dive culminated in a battle with a confluence of historical supports spanning the recovery years of 2016 and 2017 and an attempted bounce from last December’s correction low. That battle has ultimately been lost after a climactic 20% dive since end-July. The key declining trendline is now the last bastion of credible support before 171.53p. That was the 1st September 2018 kick-off point of an up leg that topped at 330p in February the following year.
Glencore CFD – daily
Source: City Index
From time to time, StoneX Financial Pty Ltd (“we”, “our”) website may contain links to other sites and/or resources provided by third parties. These links and/or resources are provided for your information only and we have no control over the contents of those materials, and in no way endorse their content. Any analysis, opinion, commentary or research-based material on our website is for information and educational purposes only and is not, in any circumstances, intended to be an offer, recommendation or solicitation to buy or sell. You should always seek independent advice as to your suitability to speculate in any related markets and your ability to assume the associated risks, if you are at all unsure. No representation or warranty is made, express or implied, that the materials on our website are complete or accurate. We are not under any obligation to update any such material.
As such, we (and/or our associated companies) will not be responsible or liable for any loss or damage incurred by you or any third party arising out of, or in connection with, any use of the information on our website (other than with regards to any duty or liability that we are unable to limit or exclude by law or under the applicable regulatory system) and any such liability is hereby expressly disclaimed.
City Index is a trading name of StoneX Financial Pty Ltd.
The material provided herein is general in nature and does not take into account your objectives, financial situation or needs.
While every care has been taken in preparing this material, we do not provide any representation or warranty (express or implied) with respect to its completeness or accuracy. This is not an invitation or an offer to invest nor is it a recommendation to buy or sell investments.
StoneX recommends you to seek independent financial and legal advice before making any financial investment decision. Trading CFDs and FX on margin carries a higher level of risk, and may not be suitable for all investors. The possibility exists that you could lose more than your initial investment further CFD investors do not own or have any rights to the underlying assets.
It is important you consider our Financial Services Guide and Product Disclosure Statement (PDS) available at www.cityindex.com/en-au/terms-and-policies/, before deciding to acquire or hold our products. As a part of our market risk management, we may take the opposite side of your trade. Our Target Market Determination (TMD) is also available at www.cityindex.com/en-au/terms-and-policies/.
StoneX Financial Pty Ltd, Suite 28.01, 264 George Street, Sydney, NSW 2000 (ACN 141 774 727, AFSL 345646) is the CFD issuer and our products are traded off exchange.
© City Index 2024