GBPUSD rallies to key resistance ahead of US retail sales
The pound has been on a tear today, rising across the board. The GBP/JPY has led the advance, thanks to ongoing “risk-on” rally undermining the Japanese yen. The GBP/USD is also up sharply and is the pair to watch ahead of today’s publication of US August retail sales and the Federal Reserve rate decision next week.
Sentiment has turned positive towards the pound in recent days as investors price out the risks of the UK crashing out of the EU without a deal, after a bill became law that forces the government to seek an extension beyond October 31 deadline in order to avoid a no-deal Brexit. It remains to be seen however whether the pound will be able to reclaim further lost ground, given the current state of British politics and uncertain times over the coming months.
Regardless of the longer-term fundamental backdrop, short-term traders need to watch incoming data and price action closely here.
Today, US retail sales has the potential to move the dollar, which in turn could impact the GBP/USD exchange rate should we get a sizeable deviation from the expected readings. Headline retail sales are seen rising 0.2% month-over-month following a 0.7% jump the month before. Core sales are expected to come in at +0.1% after a +1.0% print in July.
Form a technical point of view, the current price structure on the cable is that of a reversal profile following that false breakdown attempt below the 1.20 handle earlier this month. Since then, the bears have been getting trapped as rates squeezed higher. But now we have arrived at an inflection point near the 1.25 handle.
At 1.2475, the GBP/USD was testing the low from last year, at the time of this wiring. Once support, this level has the potential to turn into major resistance. Slightly above the psychologically-important 1.25 handle we have the 38.2% Fibonacci retracement level against last year’s high. Given the convergence of these technical factors, there is a chance for a pullback of some sort here.
In terms of the next key support, the area between 1.2365 and 1.2385 was the most recent resistance range to keep an eye on. Now that we have broken above it, the bulls will need to defend this zone upon a potential re-test. However, in the event price breaks back below this zone, then this would flip the bias back to the bearish side. Specifically, a break below 1.2285 is required to completely invalidate the bullish bias.
Meanwhile, in the event that the GBP/USD eventually clears and holds above the 1.25 handle, then in that case we could see the rally extend towards the 50% retracement level at 1.2670 or even the 200-day moving average around the 1.2735 area.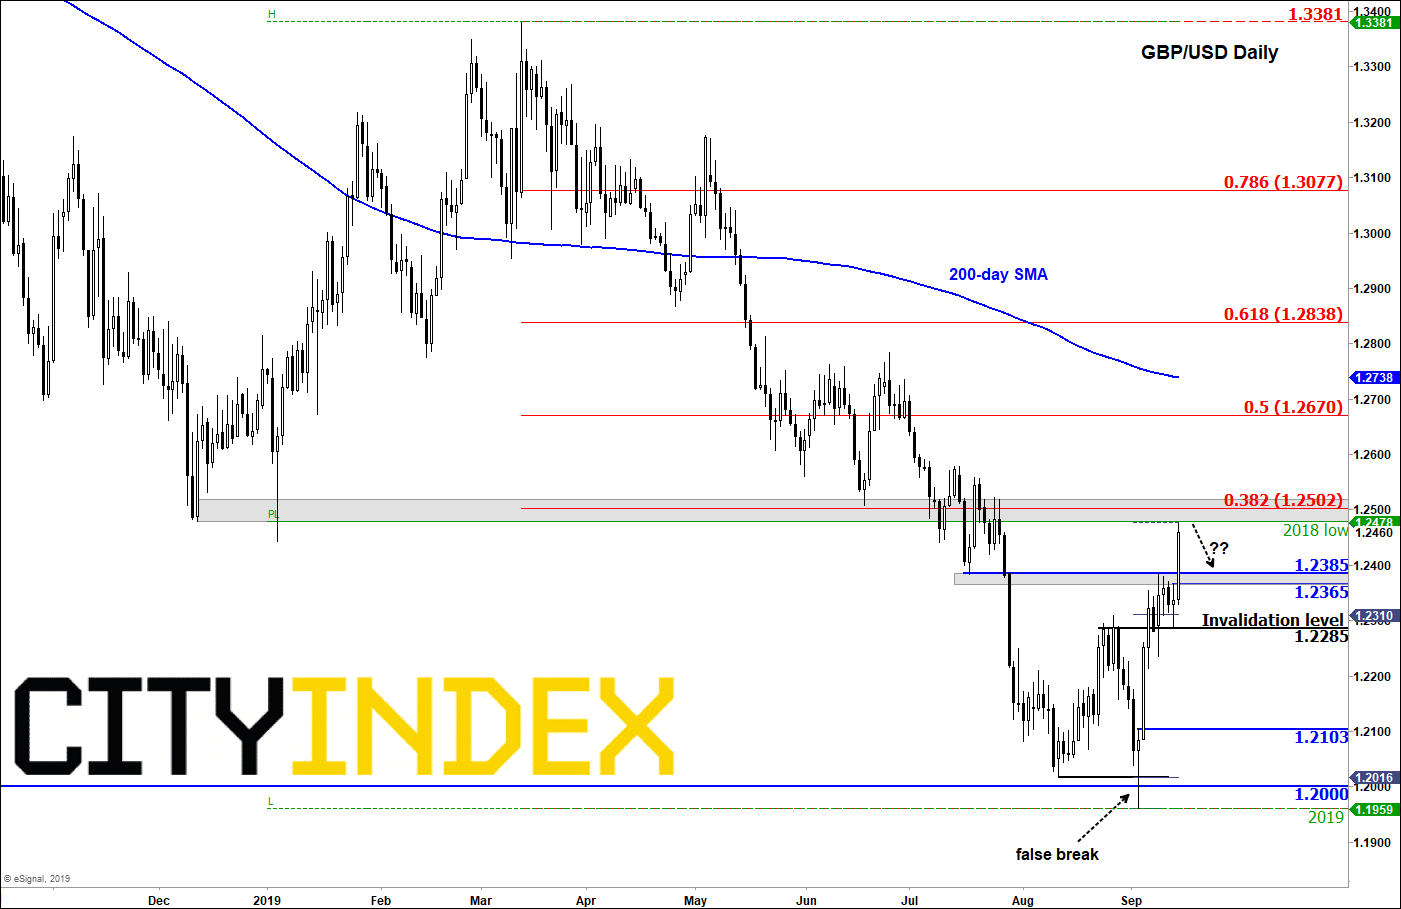
Source: eSignal and City Index.
From time to time, StoneX Financial Pty Ltd (“we”, “our”) website may contain links to other sites and/or resources provided by third parties. These links and/or resources are provided for your information only and we have no control over the contents of those materials, and in no way endorse their content. Any analysis, opinion, commentary or research-based material on our website is for information and educational purposes only and is not, in any circumstances, intended to be an offer, recommendation or solicitation to buy or sell. You should always seek independent advice as to your suitability to speculate in any related markets and your ability to assume the associated risks, if you are at all unsure. No representation or warranty is made, express or implied, that the materials on our website are complete or accurate. We are not under any obligation to update any such material.
As such, we (and/or our associated companies) will not be responsible or liable for any loss or damage incurred by you or any third party arising out of, or in connection with, any use of the information on our website (other than with regards to any duty or liability that we are unable to limit or exclude by law or under the applicable regulatory system) and any such liability is hereby expressly disclaimed.
City Index is a trading name of StoneX Financial Pty Ltd.
The material provided herein is general in nature and does not take into account your objectives, financial situation or needs.
While every care has been taken in preparing this material, we do not provide any representation or warranty (express or implied) with respect to its completeness or accuracy. This is not an invitation or an offer to invest nor is it a recommendation to buy or sell investments.
StoneX recommends you to seek independent financial and legal advice before making any financial investment decision. Trading CFDs and FX on margin carries a higher level of risk, and may not be suitable for all investors. The possibility exists that you could lose more than your initial investment further CFD investors do not own or have any rights to the underlying assets.
It is important you consider our Financial Services Guide and Product Disclosure Statement (PDS) available at www.cityindex.com/en-au/terms-and-policies/, before deciding to acquire or hold our products. As a part of our market risk management, we may take the opposite side of your trade. Our Target Market Determination (TMD) is also available at www.cityindex.com/en-au/terms-and-policies/.
StoneX Financial Pty Ltd, Suite 28.01, 264 George Street, Sydney, NSW 2000 (ACN 141 774 727, AFSL 345646) is the CFD issuer and our products are traded off exchange.
© City Index 2024