Forward Returns Following A US102 Year Inversion
A look at how markets have performed following a US 10-2 yield curve inversion.
Unless you’ve been living under a rock, you may have heard a thing or two about the yield curve inverting in the news recently. In fact, you probably heard the several months lead-up to its potential too. Well, the yield curve has indeed inverted and sparked a fresh round of calls for a recession some time over the next 20 or so months (although estimates do vary in the timing).
As my colleague Joe Perry pointed out, regardless of whether a session materialises, equites have tended to bounce after such a signal. So, we’ll start with backing this up with a chart and see how other markets reacted following an inverted 10-2 yr yield curve.
\
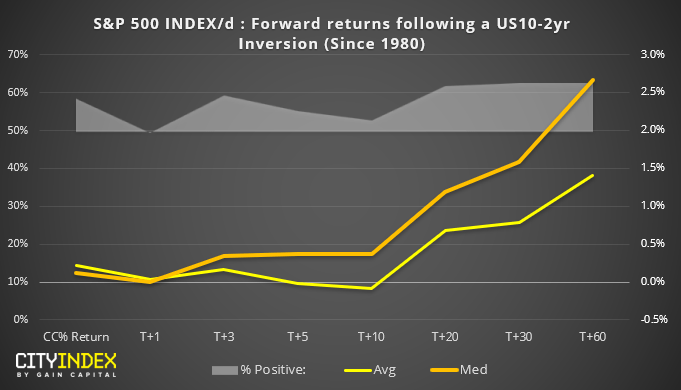
- Basically, an inverted yield curve has been positive for stocks overall
- Median prices (ie typically) trend higher between 0-3 months after the yield curve inverted
- Interestingly, on average the S&P500 was trading lower from 1-2 weeks out but, overall trends higher as it moves towards +3 months
- With exception to the next day, average returns were positive over 50% of time
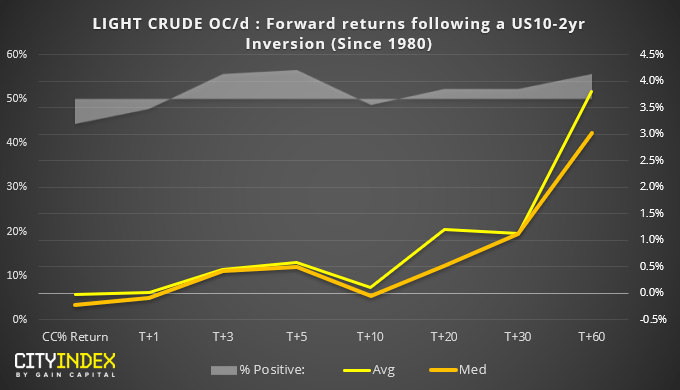
- Somewhat surprisingly, WTI appears to show an even clearer trend than the S&P500
- Average returns are positive (and over 50% of the time) around the first week, and become increasingly more bullish from 1 to 3 months after the inversion
- It’s good to see average and median prices moving in lockstep, as it suggests the average returns are not powered by a few outliers
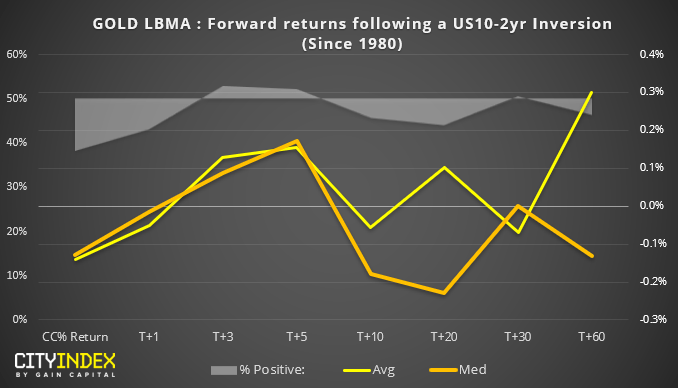
- Another surprise, this time from gold, where a trend is hard to decipher
- My expectations of a bullish trend have not been met
- With median prices negative one month after, with the average positive, there’s clearly some outliers here to push the average up
- Overall, gold’s pattern it too difficult to decipher to read much into it, surrounding inversions over this time horizon
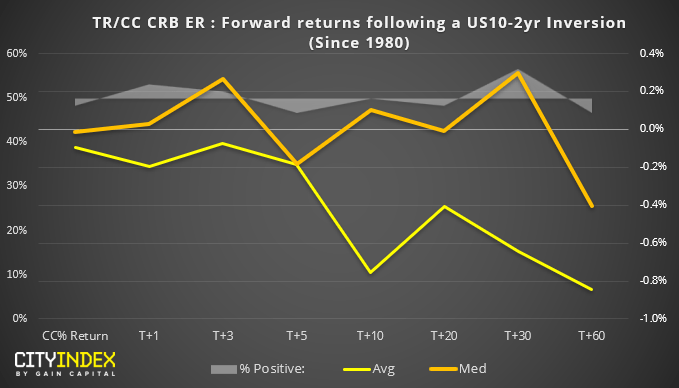
- Taking a broader look at commodities (using the CRB Core Commodity Index) shows that, overall, commodities come under pressure
- That said, the trend is clearer on bearish average forward returns (outliers weigh it down) whilst median (ie typical) prices meander between bullish and bearish
- Whilst we could argue broad commodity prices are bearish on average, the trend is not as compelling as seen on S&P500 or WTI
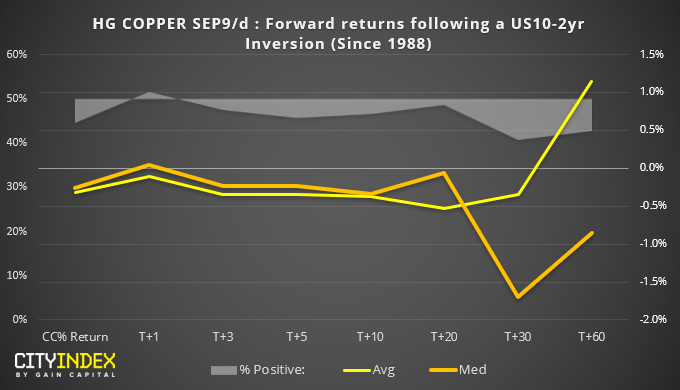
- Copper prices tend to come under pressure for the month following the yield curve inversion
- Median prices remain bearish for up to 3-month, yet peak around 6 weeks after the signal
- Average returns are notable bullish 3 month out, although likely fueled by outliers as median remains bearish
- On average, forward returns are bearish over 50% of the time from T+3 onwards
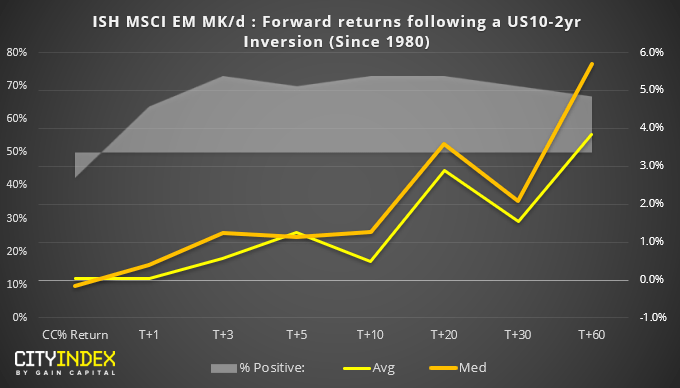
- It appears that emerging markets (EEM EFT) love a good yield curve inversion.
- What’s compelling about this chart is how average and forward returns are clearly trending higher (and increasingly so towards +3 months) whilst also over 50% of the time (excluding the day of the signal
- However… it should also be noted that the technicals for EEM ETF do not currently align with this bullish view, so we’d urge to wait for a basing pattern to be confirmed before assuming a low might be in place
- And this data set is only form 2005 (so a smaller sample size means its statistical significance may be less reliable)
Related analysis:
Yield Curve Inverted…..So What?
The Fed Are Expected To Cut Today – How Has That Fared For Markets Historically?
GBP/USD Breaks Its 52-Week Low: Has That Provided An Edge In The Past?
US Indices Closed At New Highs: Do We Hold Or Fold?
Bitcoin: Do Volatile Bullish Sessions Lead To Further Gains?
From time to time, StoneX Financial Pty Ltd (“we”, “our”) website may contain links to other sites and/or resources provided by third parties. These links and/or resources are provided for your information only and we have no control over the contents of those materials, and in no way endorse their content. Any analysis, opinion, commentary or research-based material on our website is for information and educational purposes only and is not, in any circumstances, intended to be an offer, recommendation or solicitation to buy or sell. You should always seek independent advice as to your suitability to speculate in any related markets and your ability to assume the associated risks, if you are at all unsure. No representation or warranty is made, express or implied, that the materials on our website are complete or accurate. We are not under any obligation to update any such material.
As such, we (and/or our associated companies) will not be responsible or liable for any loss or damage incurred by you or any third party arising out of, or in connection with, any use of the information on our website (other than with regards to any duty or liability that we are unable to limit or exclude by law or under the applicable regulatory system) and any such liability is hereby expressly disclaimed.
City Index is a trading name of StoneX Financial Pty Ltd.
The material provided herein is general in nature and does not take into account your objectives, financial situation or needs.
While every care has been taken in preparing this material, we do not provide any representation or warranty (express or implied) with respect to its completeness or accuracy. This is not an invitation or an offer to invest nor is it a recommendation to buy or sell investments.
StoneX recommends you to seek independent financial and legal advice before making any financial investment decision. Trading CFDs and FX on margin carries a higher level of risk, and may not be suitable for all investors. The possibility exists that you could lose more than your initial investment further CFD investors do not own or have any rights to the underlying assets.
It is important you consider our Financial Services Guide and Product Disclosure Statement (PDS) available at www.cityindex.com/en-au/terms-and-policies/, before deciding to acquire or hold our products. As a part of our market risk management, we may take the opposite side of your trade. Our Target Market Determination (TMD) is also available at www.cityindex.com/en-au/terms-and-policies/.
StoneX Financial Pty Ltd, Suite 28.01, 264 George Street, Sydney, NSW 2000 (ACN 141 774 727, AFSL 345646) is the CFD issuer and our products are traded off exchange.
© City Index 2024