Featured Trade Bullish exhaustion seen in AUDJPY ahead of RBA
Short-term technical outlook on AUD/JPY (Mon 01 Jul)
click to enlarge charts
The Australian central bank, RBA will hold its monetary policy meeting tom, 02 Ju at 0430 GMT. Market participants and the ASX interbank futures market are expecting another cut on its policy cash rate to 1.00%, a fresh record low. Please click here to read our RBA’s preview.
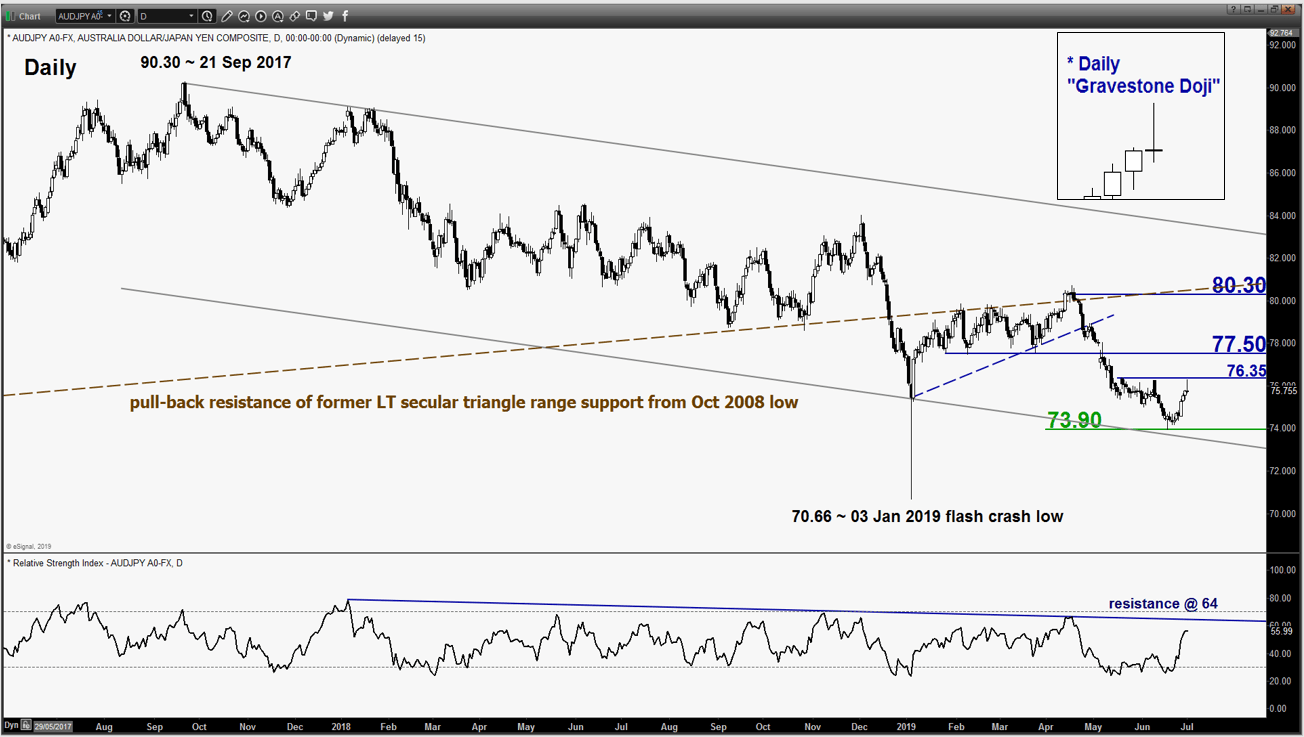
The AUD/JPY cross pair is now displaying an interestingly technical set-up as follow;
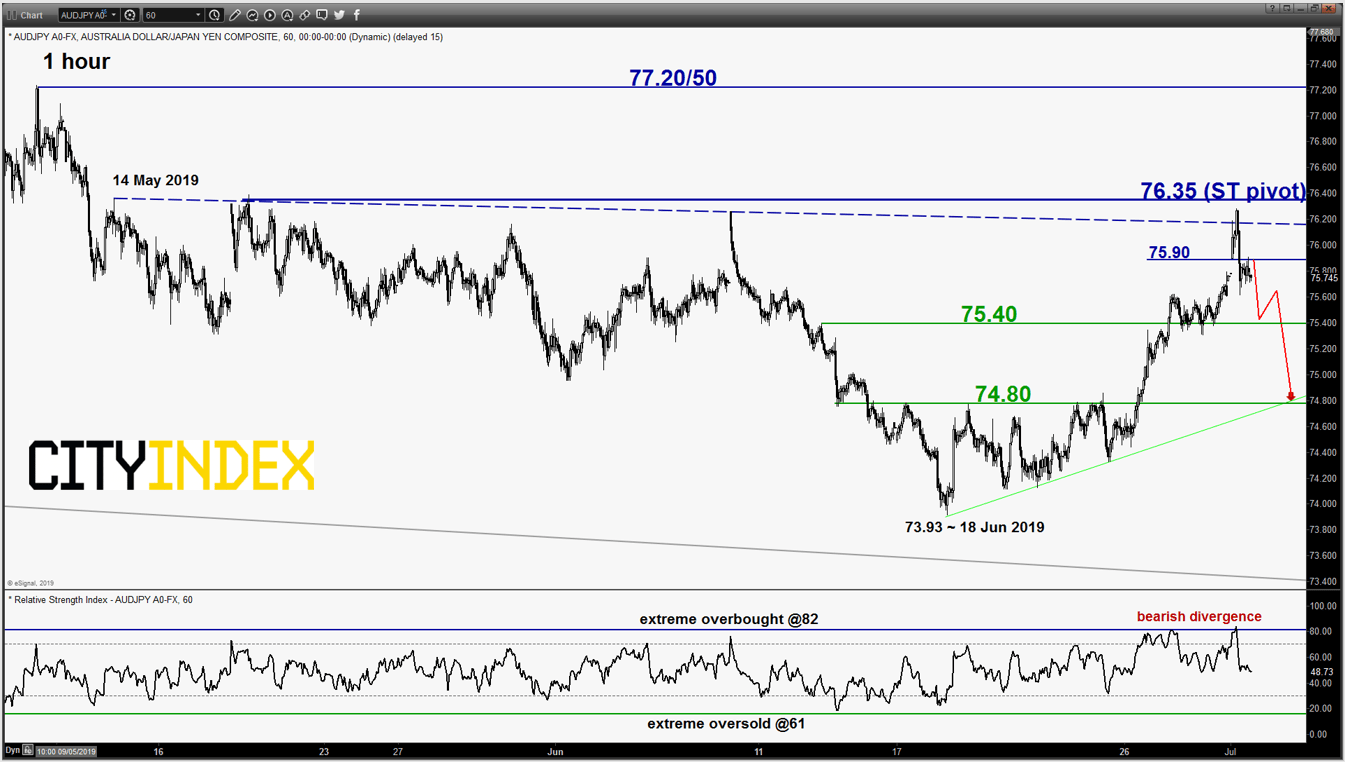
- The recent rebound of 235 pips from its 18 Jun 2019 low of 73.93 has reached a key short-term resistance of 76.35 as defined by the swing high areas of 20 May/10 Jun 2019 and a Fibonacci retracement/expansion cluster.
- Bullish exhaustion signs have started to emerge at the 76.35 resistance where it has formed an impending bearish daily “Gravestone Doji” candlestick pattern coupled with a bearish divergence seen in the shorter-term 1-hour RSI oscillator at its extreme overbought level.
- The next significant near-term supports rest at 75.40 and 74.80 (also the minor ascending trendline from 18 Jun 2019 low & 61.8% Fibonacci retracement of the recent rebound from 18 Jun low to 01 Jul 2019 current intraday high).
Key Levels (1 to 3 days)
Intermediate resistance: 75.90
Pivot (key resistance): 76.35
Supports: 75.40 & 74.80
Next resistance: 77.20/50
Conclusion
If the 76.35 key short-term pivotal resistance is not surpassed, the AUD/JPY may see a further potential slide to target the next near-term supports at 75.40 and 74.80 next.
On the flipside, an hourly close above 76.35 invalidates the bearish scenario for an extension of the corrective rebound towards the next resistance at 77.20/50 (former range resistance from 25 Jan/22 Mar 2019 & 50% Fibonacci retracement of the retracement of the recent decline from 17 Apr high to 18 Jun 2019 low).
From time to time, StoneX Financial Pty Ltd (“we”, “our”) website may contain links to other sites and/or resources provided by third parties. These links and/or resources are provided for your information only and we have no control over the contents of those materials, and in no way endorse their content. Any analysis, opinion, commentary or research-based material on our website is for information and educational purposes only and is not, in any circumstances, intended to be an offer, recommendation or solicitation to buy or sell. You should always seek independent advice as to your suitability to speculate in any related markets and your ability to assume the associated risks, if you are at all unsure. No representation or warranty is made, express or implied, that the materials on our website are complete or accurate. We are not under any obligation to update any such material.
As such, we (and/or our associated companies) will not be responsible or liable for any loss or damage incurred by you or any third party arising out of, or in connection with, any use of the information on our website (other than with regards to any duty or liability that we are unable to limit or exclude by law or under the applicable regulatory system) and any such liability is hereby expressly disclaimed.
City Index is a trading name of StoneX Financial Pty Ltd.
The material provided herein is general in nature and does not take into account your objectives, financial situation or needs.
While every care has been taken in preparing this material, we do not provide any representation or warranty (express or implied) with respect to its completeness or accuracy. This is not an invitation or an offer to invest nor is it a recommendation to buy or sell investments.
StoneX recommends you to seek independent financial and legal advice before making any financial investment decision. Trading CFDs and FX on margin carries a higher level of risk, and may not be suitable for all investors. The possibility exists that you could lose more than your initial investment further CFD investors do not own or have any rights to the underlying assets.
It is important you consider our Financial Services Guide and Product Disclosure Statement (PDS) available at www.cityindex.com/en-au/terms-and-policies/, before deciding to acquire or hold our products. As a part of our market risk management, we may take the opposite side of your trade. Our Target Market Determination (TMD) is also available at www.cityindex.com/en-au/terms-and-policies/.
StoneX Financial Pty Ltd, Suite 28.01, 264 George Street, Sydney, NSW 2000 (ACN 141 774 727, AFSL 345646) is the CFD issuer and our products are traded off exchange.
© City Index 2024