Featured Trade AUDNZD still evolving within minor descending channel as RBA looms
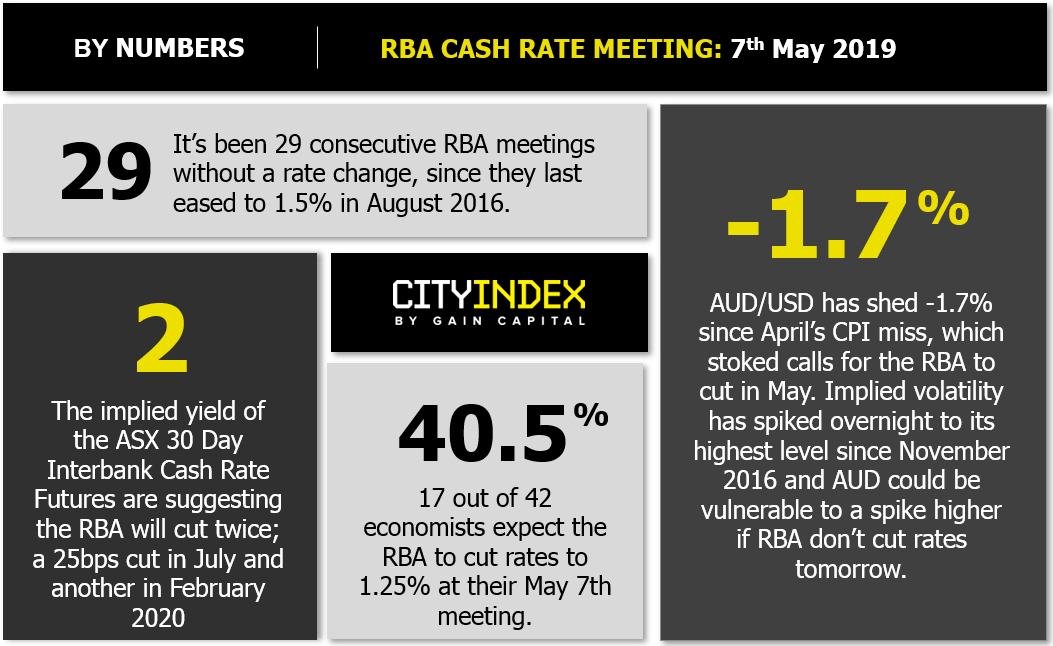
- The Australian central bank, RBA has held its key policy cash rate steady at 1.5% since its last cut in Aug 2016. On the back of the recent weak inflationary data where Q1 2019 CPI declined to 1.3% y/y, the weakest inflation growth since Jan 2017 and inflationary pressure in Australia has been continued to fall from its peak of 2.1% y/y seen in mid-2018.
- Given such lacklustre data, the financial markets have started to price in an imminent interest rate cut from the RBA where the ASX Cash Rate futures is projecting a 25bps cut in July and another cut in Feb 2020. Even a small majority of economists of 40.5% polled by Reuters are expecting a rate cut from RBA after its monetary policy meeting conclude at 0430 GMT.
- If RBA decides to put its cash rate hold tomorrow but offers a dovish guidance in its monetary policy statement to pave the way for at cut in the next July meeting, the AUD is likely to face downside pressure coupled with renewed trade tension between U.S and China after President Trump’s latest tweets on the intention to increase tariffs on Chinese imports this Friday.
Short-term technical outlook on AUD/NZD (Tues, 07 May)
click to enlarge charts
Key elements
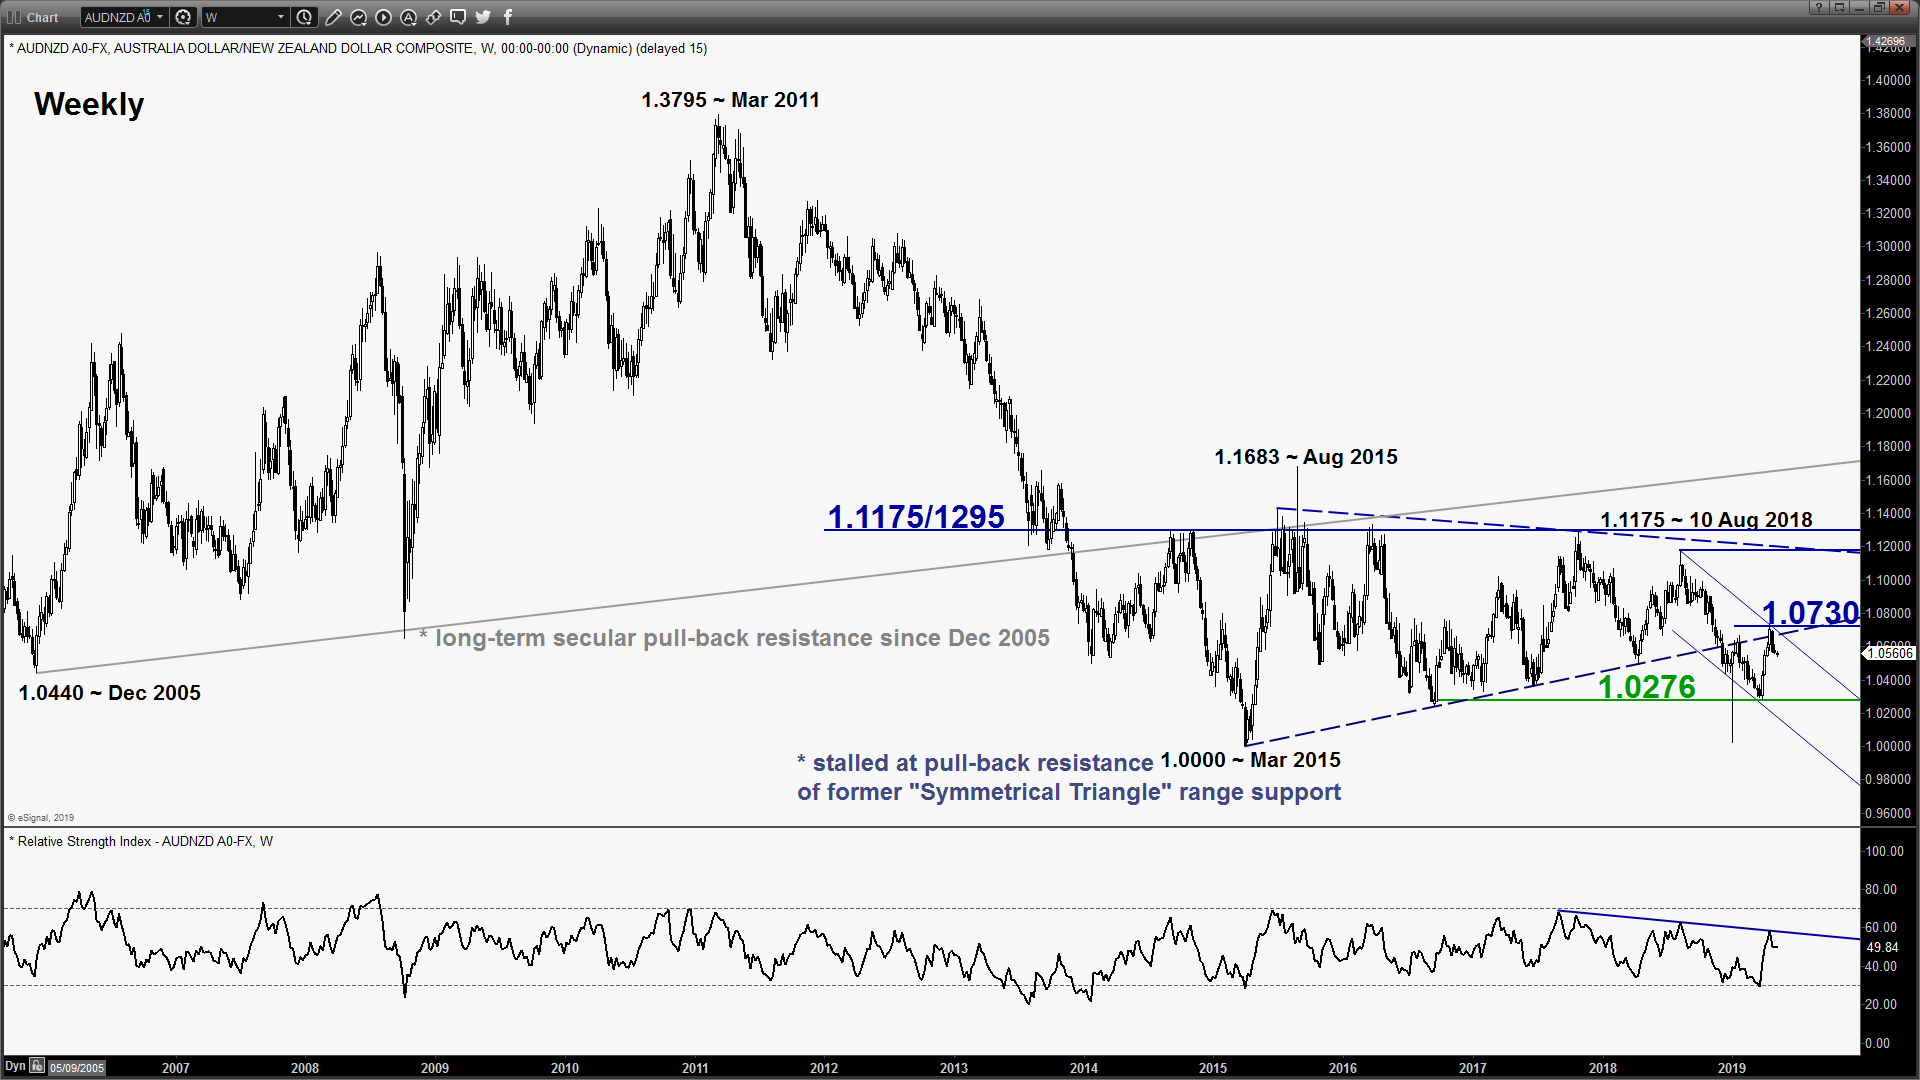
- The rebound from 25 Mar 2019 low of 1.0272 to 17 Apr 2019 high of 1.0732 has stalled at the pull-back resistance of a former major “Symmetrical Triangle” range support from Mar 2015 (see weekly chart).
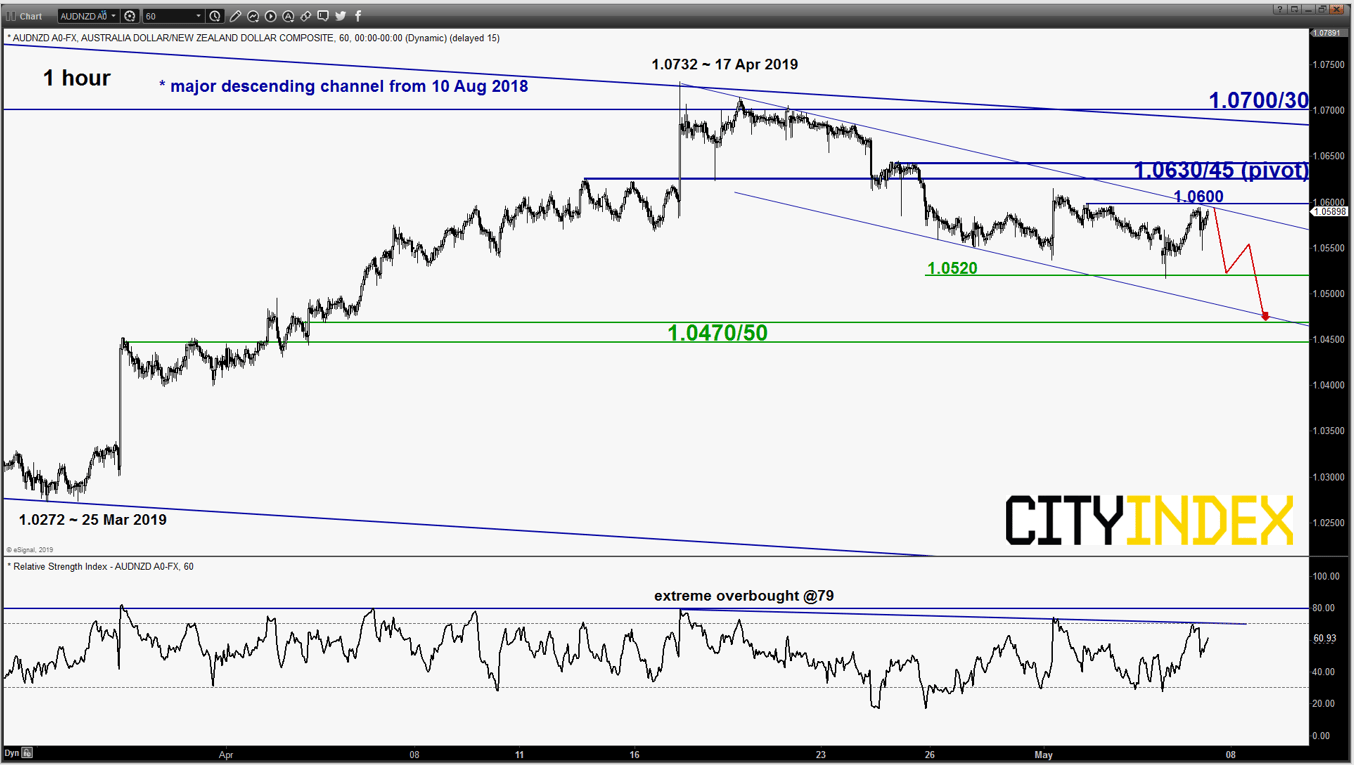
- The AUD/NZD has started to drift downwards from the 17 Apr 2019 high of 1.0732 has evolved within a minor descending channel with its upper boundary acting as an intermediate resistance at 1.0600 (see 1-hour chart).
- Hourly RSI oscillator is now coming close to its overbought region and a significant corresponding descending resistance at the 70 level. These observations suggest the price action of the cross pair shows the risk of a minor downside reversal after a rebound seen yesterday from 06 May 2019 swing low area of 1.0520.
- The next significant near-term supports at 1.0470/50 which is defined by the lower boundary of the minor descending channel and the 61.8% Fibonacci retracement of the rebound from 25 Mar 2019 low to 17 Apr 2019 high.
Key Levels (1 to 3 days)
Intermediate resistance: 1.0600
Pivot (key resistance): 1.0630/45
Supports: 1.0520 & 1.0470/50
Next resistance: 1.0700/30 (medium-term pivot)
Conclusion
If the 1.0630/45 short-term pivotal resistance is not surpassed, the AUD/NZD cross pair is likely to see another potential minor downleg to retest 1.0520 before targeting to the next support at 1.0470/50.
On the other hand, a clearance above 1.0645 invalidates the bearish scenario for a squeeze up towards 1.0700/30 key medium-term pivotal resistance (also the upper boundary of a major descending channel from 10 Aug 2018 high).
From time to time, StoneX Financial Pty Ltd (“we”, “our”) website may contain links to other sites and/or resources provided by third parties. These links and/or resources are provided for your information only and we have no control over the contents of those materials, and in no way endorse their content. Any analysis, opinion, commentary or research-based material on our website is for information and educational purposes only and is not, in any circumstances, intended to be an offer, recommendation or solicitation to buy or sell. You should always seek independent advice as to your suitability to speculate in any related markets and your ability to assume the associated risks, if you are at all unsure. No representation or warranty is made, express or implied, that the materials on our website are complete or accurate. We are not under any obligation to update any such material.
As such, we (and/or our associated companies) will not be responsible or liable for any loss or damage incurred by you or any third party arising out of, or in connection with, any use of the information on our website (other than with regards to any duty or liability that we are unable to limit or exclude by law or under the applicable regulatory system) and any such liability is hereby expressly disclaimed.
City Index is a trading name of StoneX Financial Pty Ltd.
The material provided herein is general in nature and does not take into account your objectives, financial situation or needs.
While every care has been taken in preparing this material, we do not provide any representation or warranty (express or implied) with respect to its completeness or accuracy. This is not an invitation or an offer to invest nor is it a recommendation to buy or sell investments.
StoneX recommends you to seek independent financial and legal advice before making any financial investment decision. Trading CFDs and FX on margin carries a higher level of risk, and may not be suitable for all investors. The possibility exists that you could lose more than your initial investment further CFD investors do not own or have any rights to the underlying assets.
It is important you consider our Financial Services Guide and Product Disclosure Statement (PDS) available at www.cityindex.com/en-au/terms-and-policies/, before deciding to acquire or hold our products. As a part of our market risk management, we may take the opposite side of your trade. Our Target Market Determination (TMD) is also available at www.cityindex.com/en-au/terms-and-policies/.
StoneX Financial Pty Ltd, Suite 28.01, 264 George Street, Sydney, NSW 2000 (ACN 141 774 727, AFSL 345646) is the CFD issuer and our products are traded off exchange.
© City Index 2024