eurjpy euros best chance of recovery against weaker rivals 2686662017
So much for the recovery in the Eurozone. Today’s economic pointers from the single currency bloc were weak, though not too weak. Eurozone GDP grew in Q4 by 0.4% instead of 0.5% estimated initially. This was partly because of the slightly weaker performance from the Eurozone’s economic powerhouse, Germany, where GDP also rose 0.4% instead of 0.5% expected by analysts. What’s more, industrial production fell 1.6% in December versus a fall of 1.4% expected. Nevertheless, it should be noted that these figures were for the last quarter of 2016, in other words slightly out of date. The more up to date macro pointers for this year have been strong, most notably inflation figures. That being said, the ECB has resisted calls to tighten its policy. But if incoming data continues to improve as we expect then tapering talks should come back to the forefront, potentially causing the euro to surge higher. Granted, we are heading into a period of uncertainty in the Eurozone due to the upcoming elections in Germany, France and the Netherlands. But if the US election is anything to go by, the rise of right-wing politics in the Eurozone may not necessary mean that the euro would weaken.
BoJ likely to remain extremely accommodative longer than ECB
In any case, the euro has a much better chance of recovery against its weaker rivals – such as the Japanese yen, for example – than, say, the US dollar, where the Fed has turned hawkish. Although the EUR/JPY is lower year-to-date, the long-term outlook still remains bullish. I believe that due to the demographics of an aging population in Japan and lack of inflation that the Bank of Japan’s monetary policy will likely remain extremely accommodative for much longer than that of the European Central Bank’s. This should help support the EUR/JPY in the long-term outlook.
EUR/JPY still in bullish market structure despite weakness in 2017
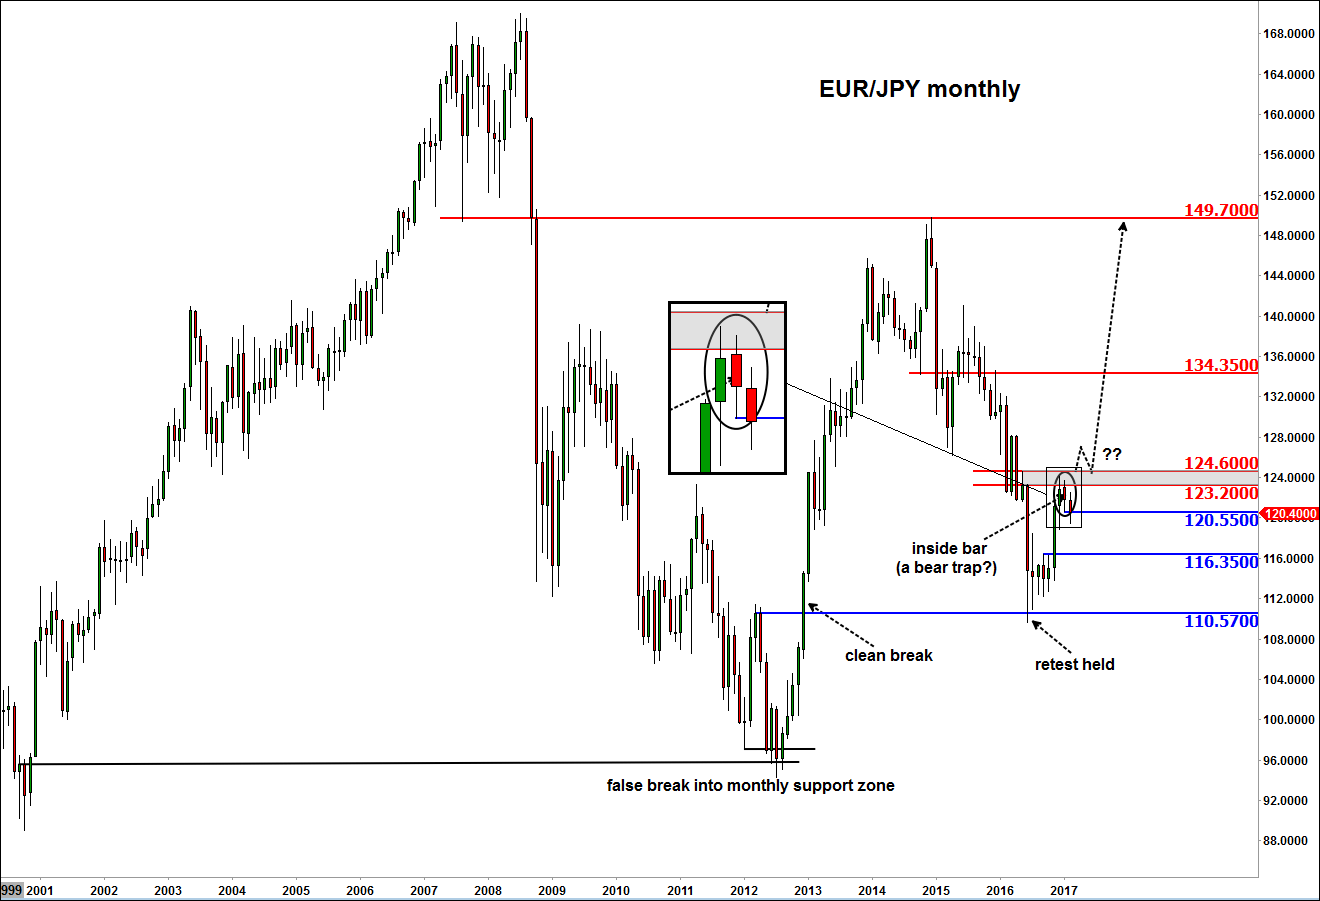
Indeed, the long-term monthly chart of the EUR/JPY still suggests that price is residing inside a bullish market structure. As per the chart, all of the long-term support levels have held such as 95.00 back in the year 2012 and more recently 110.00 in June 2016. A slow start to this year saw the EUR/JPY create an inside bar monthly candlestick formation after a sharp rally in November and some follow-through in December. Now that the EUR/JPY has broken below January’s range, what we want to see is whether there will be any follow-though in the selling pressure or not. Given what we think is a bullish market structure, we are of the view that the inside bar formation could be a trap to get the sellers in before price potentially rips higher. So if the EUR/JPY moves back above 120.55 and holds there then this could become a strong possibility, potentially leading to a surge above the old resistance area circa 124.00.
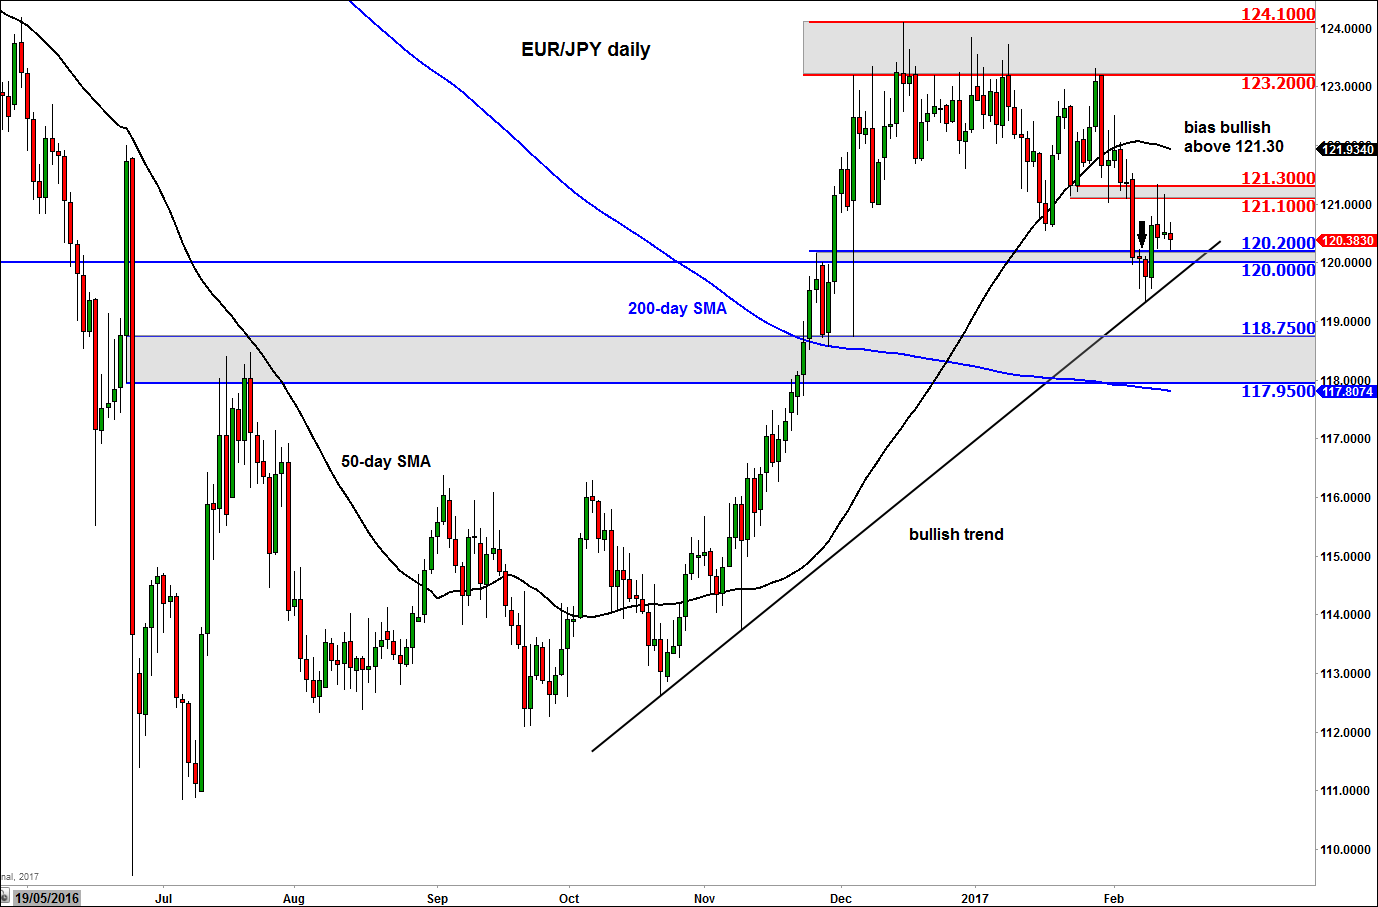
In the more near-term outlook, the trend is not so clear. On the daily time frame, the shapes of the candlestick patterns from the previous two days appear bearish at first sight. After all, the broken support at 121.10/30 held as resistance twice and price created an inverted hammer on Friday and a doji candle on Monday. Under normal circumstances these candlestick patterns would suggest price would be heading lower. Well today, the EUR/JPY did break a little lower and moved below Monday’s range. However, at the time of this writing, there wasn’t much follow-through in the downside as the key support area of 120.00/20 held firm again. With the EUR/JPY residing above the 200-day moving average and having recently broken down a long-term bearish trend line, any potential weakness here could signal the resumption of the bullish trend. This view would be support further if the EUR/JPY were to take out resistance around the 121.10/30 area now. If successful, then it will become highly likely that the EUR/JPY may go on to test the next liquidity pool above the 123.20/124.10 area, where there is undoubtedly some significant stop orders from those who have been selling this pair. Thus the prospects of a sharp short-squeeze rally is there.
This bullish view would become weak however if the rising trend line breaks down on the daily time frame. In this potential scenario, the EUR/JPY may fall to re-test the large support zone between 117.95 and 118.75 before deciding on its next move. On the monthly time frame, the next key support is at 116.35, the last high pre breakout. So long as this level holds on a monthly closing basis, the long-term bullish bias would still remain intact, though the bulls would ideally prefer for price not to pull back this deep.
From time to time, StoneX Financial Pty Ltd (“we”, “our”) website may contain links to other sites and/or resources provided by third parties. These links and/or resources are provided for your information only and we have no control over the contents of those materials, and in no way endorse their content. Any analysis, opinion, commentary or research-based material on our website is for information and educational purposes only and is not, in any circumstances, intended to be an offer, recommendation or solicitation to buy or sell. You should always seek independent advice as to your suitability to speculate in any related markets and your ability to assume the associated risks, if you are at all unsure. No representation or warranty is made, express or implied, that the materials on our website are complete or accurate. We are not under any obligation to update any such material.
As such, we (and/or our associated companies) will not be responsible or liable for any loss or damage incurred by you or any third party arising out of, or in connection with, any use of the information on our website (other than with regards to any duty or liability that we are unable to limit or exclude by law or under the applicable regulatory system) and any such liability is hereby expressly disclaimed.
City Index is a trading name of StoneX Financial Pty Ltd.
The material provided herein is general in nature and does not take into account your objectives, financial situation or needs.
While every care has been taken in preparing this material, we do not provide any representation or warranty (express or implied) with respect to its completeness or accuracy. This is not an invitation or an offer to invest nor is it a recommendation to buy or sell investments.
StoneX recommends you to seek independent financial and legal advice before making any financial investment decision. Trading CFDs and FX on margin carries a higher level of risk, and may not be suitable for all investors. The possibility exists that you could lose more than your initial investment further CFD investors do not own or have any rights to the underlying assets.
It is important you consider our Financial Services Guide and Product Disclosure Statement (PDS) available at www.cityindex.com/en-au/terms-and-policies/, before deciding to acquire or hold our products. As a part of our market risk management, we may take the opposite side of your trade. Our Target Market Determination (TMD) is also available at www.cityindex.com/en-au/terms-and-policies/.
StoneX Financial Pty Ltd, Suite 28.01, 264 George Street, Sydney, NSW 2000 (ACN 141 774 727, AFSL 345646) is the CFD issuer and our products are traded off exchange.
© City Index 2024