eurgbp bumper retail sales complete week full of strong uk data 2673982016
Economic data from the UK post the EU referendum has really surprised everyone this week, with inflation, jobs and now retail sales all topping expectations. It looks like Brits put Brexit miseries behind them last month as they enjoyed the relatively hot weather and splashed out on clothing and footwear, with the tourists also being encouraged by the weakness in sterling. Retail sales surged by 1.4% in July compared to a year ago, easily beating expectations of 0.1% and more than making up for the 0.9% decline reported in June.
Following this week’s stronger-than-expected UK data, the pound has correspondingly bounced back as market participants reduce their expectation about the possibility of further monetary stimulus measures from the Bank of England. The European Central Bank has also acknowledged the impact – or lack thereof – of Brexit, saying the consequences of the vote has been less marked than expected in the minutes of its last meeting, released this afternoon. However, the ECB wanted to remain cautious about the prospects of the recovery in the Eurozone and saw no clear upward trend in inflation, which was a particular concern for Peter Praet, the executive board member and chief economist at the ECB.
But the ECB is basically on holiday at the moment and no major policy changes are expected to be announced any time soon. Economic data is likewise going to be very light for the Eurozone this week, although things should pick up a little next week as we will have the latest manufacturing and services PMIs scheduled for Tuesday and the German Ifo on Thursday. From the UK, the next significant piece of data is not due until next Friday, when we will have the second estimate for the second quarter GDP. Therefore we may see further recovery in the GBP relative to the EUR if the former continues to recover on short covering.
EUR/GBP in short-term technical damage at key long-term level
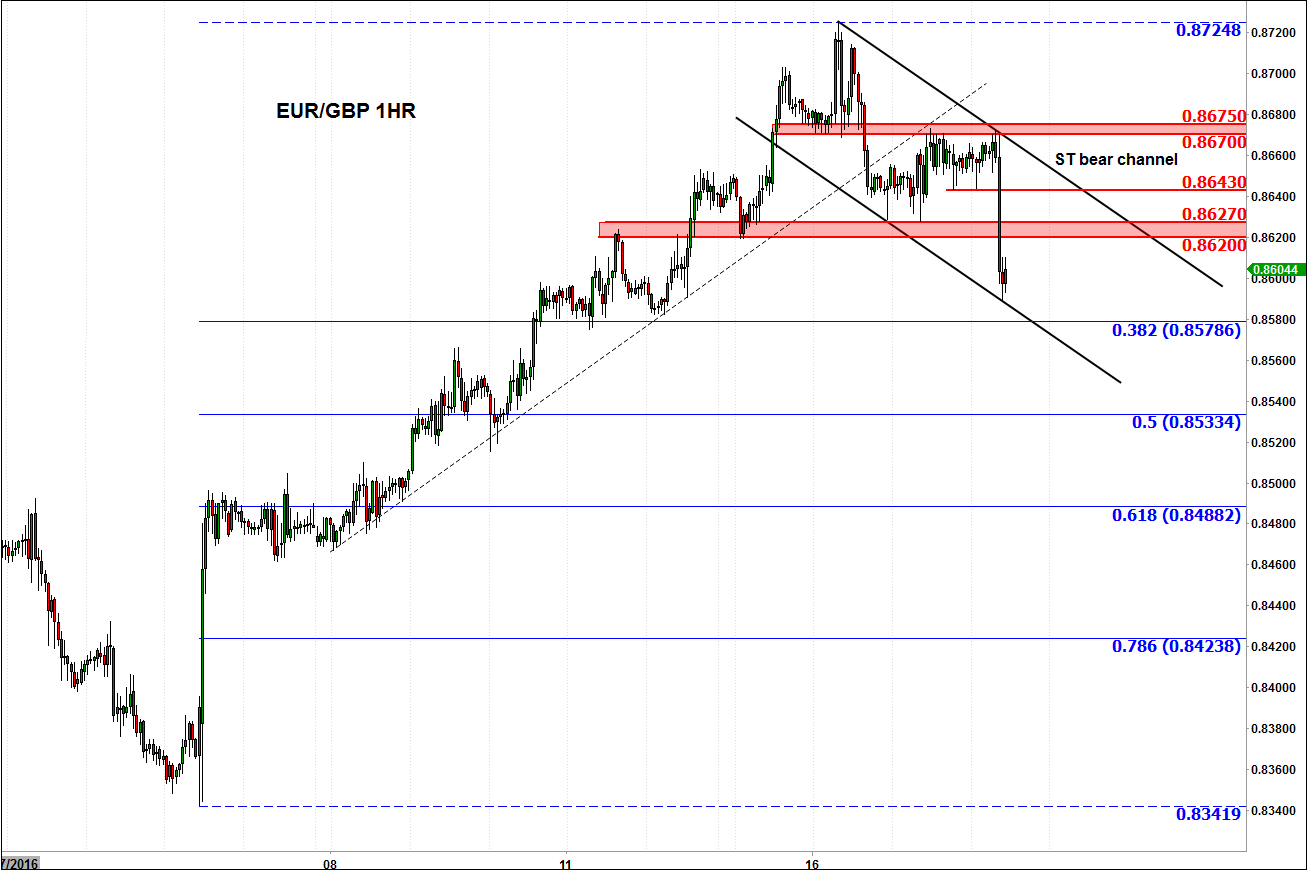
Now in the last couple of days you may have noticed on Twitter that I have been quite vocal about the EUR/GBP exchange rate as it traded around its long-term 61.8% Fibonacci retracement level (against its all-time high) at 0.9710. So far, it looks like this important Fibonacci level has been respected by the market and price has broken a few short-term support levels, which have since turned into resistance – such as 0.8670/75 on the 1-hour chart. Given the short-term technical damage here for the bulls, we anticipate there to be further weakness as these traders may abandon some of their long positions. Meanwhile, the bears, smelling blood, may pounce and take full advantage of the weakness from the bulls, applying further pressure on the cross in the short-term. So, resistance levels such as those (in red) on the 1-hour chart should be watched. The potential short-term support levels could be old highs or the Fibonacci retracement levels from the most recent rally. The short-term outlook remains bearish unless the EUR/GBP climbs out of its bearish channel or rallies back above the recent resistance range of 0.8670/75.
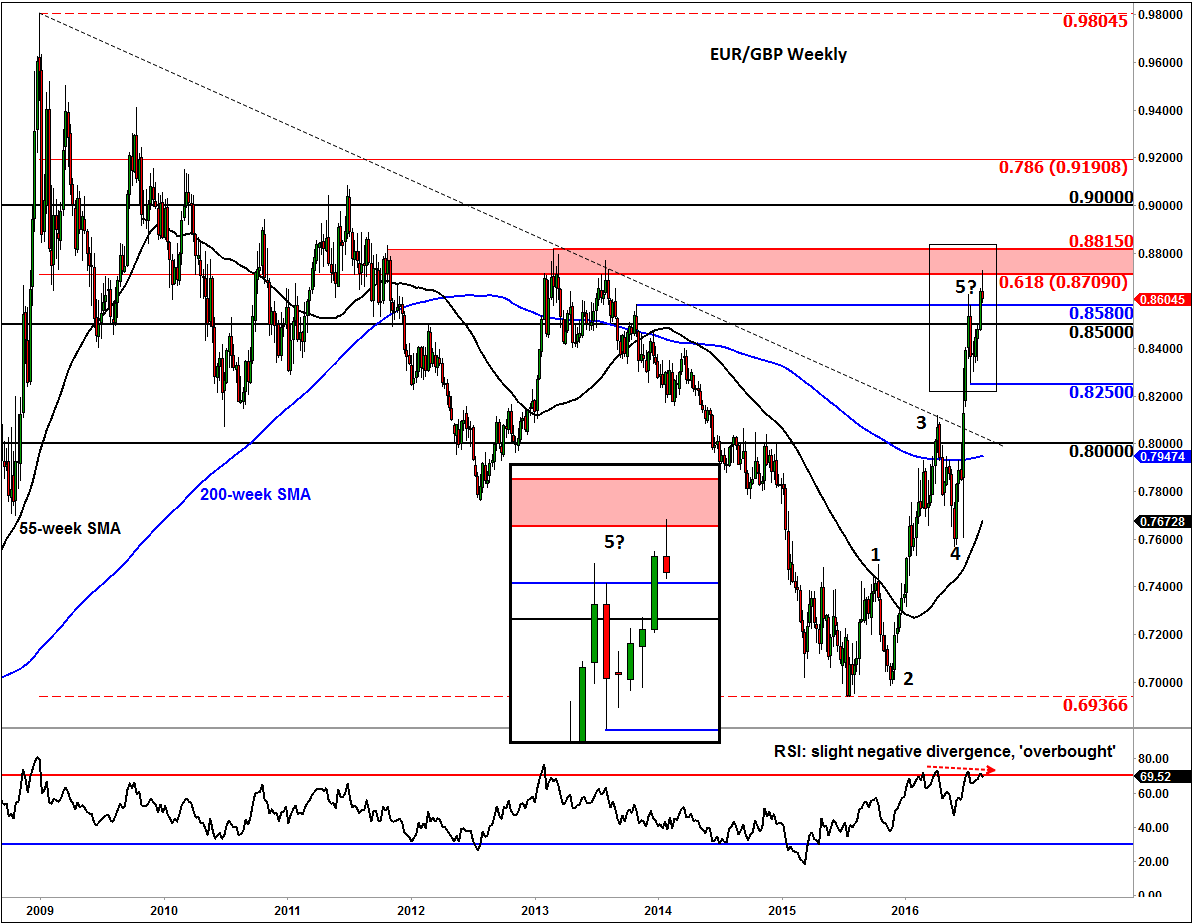
Meanwhile on the weekly time frame, the bullish outlook remains intact for now although with the RSI being around 70 it suggests that the EUR/GBP may be ‘overbought’ at this important technical area. The RSI has also formed a slight negative divergence with price, making a lower low as price made its most recent higher high. This more or less confirms what we have seen on the smaller time frame, which is that the bullish momentum is indeed fading for the time being. What’s more, Elliot Wave enthusiasts will notice that the EUR/GBP may have completed its fifth and final wave in this cycle, so an ABC correction may be forthcoming. There are however some important long-term levels that need to be watched and transposed on the intraday charts which could provide some support, such as 0.8580 (previously resistance) and the psychologically-important level of 0.8500. The long-term bullish outlook on the EUR/GBP would only become invalid upon a decisive break below the most recent low: 0.8250.
From time to time, StoneX Financial Pty Ltd (“we”, “our”) website may contain links to other sites and/or resources provided by third parties. These links and/or resources are provided for your information only and we have no control over the contents of those materials, and in no way endorse their content. Any analysis, opinion, commentary or research-based material on our website is for information and educational purposes only and is not, in any circumstances, intended to be an offer, recommendation or solicitation to buy or sell. You should always seek independent advice as to your suitability to speculate in any related markets and your ability to assume the associated risks, if you are at all unsure. No representation or warranty is made, express or implied, that the materials on our website are complete or accurate. We are not under any obligation to update any such material.
As such, we (and/or our associated companies) will not be responsible or liable for any loss or damage incurred by you or any third party arising out of, or in connection with, any use of the information on our website (other than with regards to any duty or liability that we are unable to limit or exclude by law or under the applicable regulatory system) and any such liability is hereby expressly disclaimed.
City Index is a trading name of StoneX Financial Pty Ltd.
The material provided herein is general in nature and does not take into account your objectives, financial situation or needs.
While every care has been taken in preparing this material, we do not provide any representation or warranty (express or implied) with respect to its completeness or accuracy. This is not an invitation or an offer to invest nor is it a recommendation to buy or sell investments.
StoneX recommends you to seek independent financial and legal advice before making any financial investment decision. Trading CFDs and FX on margin carries a higher level of risk, and may not be suitable for all investors. The possibility exists that you could lose more than your initial investment further CFD investors do not own or have any rights to the underlying assets.
It is important you consider our Financial Services Guide and Product Disclosure Statement (PDS) available at www.cityindex.com/en-au/terms-and-policies/, before deciding to acquire or hold our products. As a part of our market risk management, we may take the opposite side of your trade. Our Target Market Determination (TMD) is also available at www.cityindex.com/en-au/terms-and-policies/.
StoneX Financial Pty Ltd, Suite 28.01, 264 George Street, Sydney, NSW 2000 (ACN 141 774 727, AFSL 345646) is the CFD issuer and our products are traded off exchange.
© City Index 2024