eurcad one to watch 2668452016
Today’s biggest surprise was perhaps the rallying stock markets with the UK’s FTSE 100 climbing by a good 3.5%, led by stocks that had suffered heavily in the immediate aftermath of the Brexit vote. The FTSE was no doubt supported also by the rallying prices of commodities which helped the precious metals miner Fresnillo climb nearly 10% to top the index. Crude oil also jumped following the publication of the latest US stockpiles report, which showed a sharper than expected 4 million drawdown for the week ending June 24. This added further fuel to the stock market rally, but as of yet it hasn’t provided significant support for the Canadian dollar. The latter was flat against the euro, but did manage to rise slightly against the US dollar which fell not only because of today’s “risk-on” trade but also because of poor economic data in the US as pending home sales dropped some 3.7% month over month in May, which was also the first drop on a year-over-year basis since August 2014.
Looking ahead to tomorrow, the economic calendar is busier with lots of European data scheduled for release in the morning including German Retail Sales and Unemployment Change, French Consumer Spending and Eurozone CPI Flash Estimate. In the afternoon, we will have the monthly Canadian GDP estimate followed by US weekly unemployment claims and Chicago PMI.
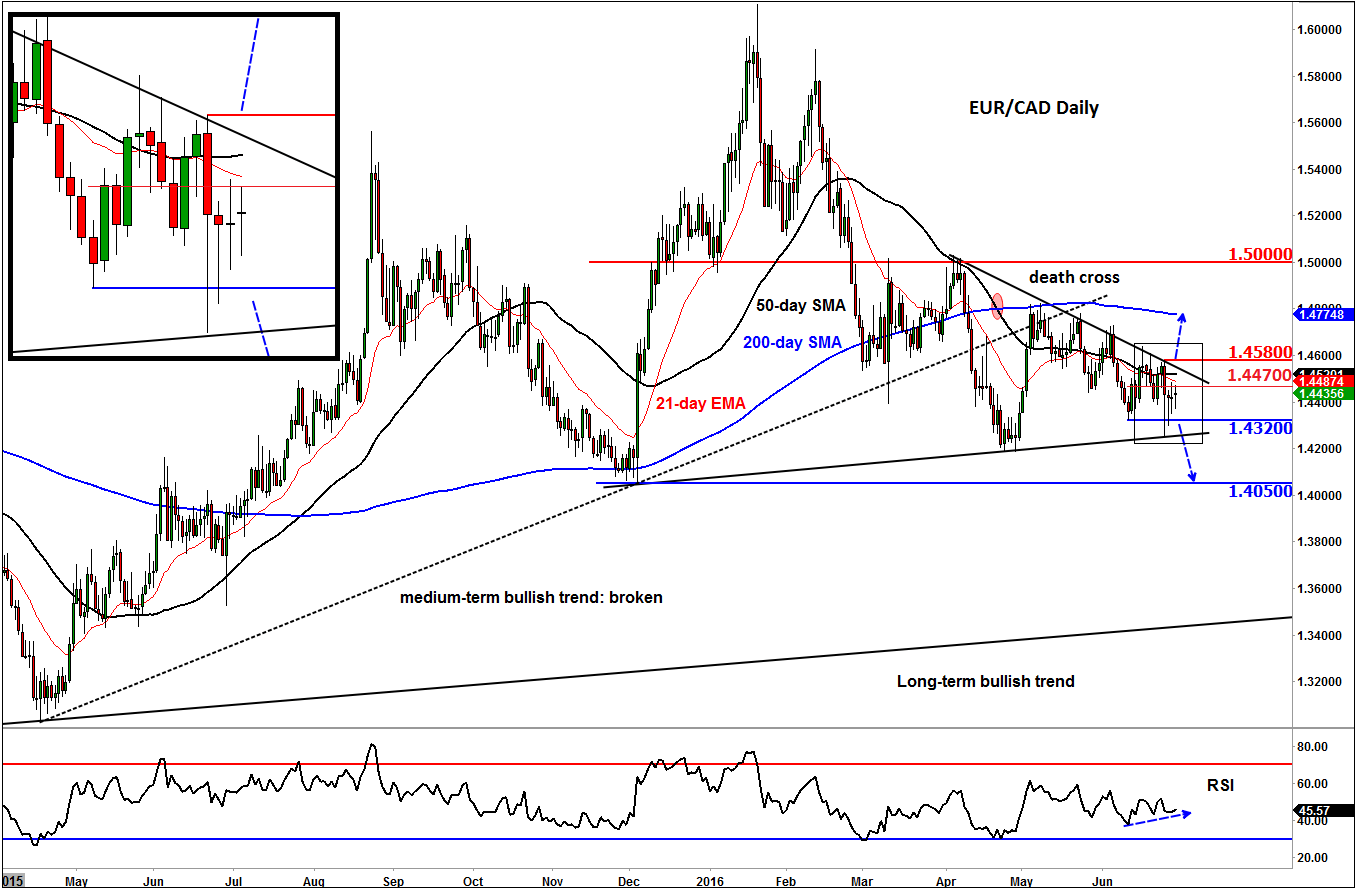
Technical outlook: EUR/CAD
The European data may help inspire the EUR/CAD to make a decisive move after its recent consolidation. This cross has been making a series of lower highs and lower lows in recent times, causing the moving averages to move in the “wrong” order. The EUR/CAD has already broken a medium-term bullish trend line, too, although it remains well above its long-term upward trend. Meanwhile, after forming a large bearish engulfing candle on Friday, the EUR/CAD has created an inside bar, a doji and today another inside bar formation on its daily chart. These candlestick formations point to indecision, but Friday’s bearish engulfing candle suggests that underlying trend is essentially bearish.
Given these technical indications, the cross is more likely to head lower than higher in the coming weeks. As such, traders should watch price action around key resistance levels closely – such as 1.4470, which was being tested at the time of this writing. If support at 1.4320 breaks down, then we may see the start of a more significant move to the downside, perhaps towards 1.4050 initially. This bearish view will become invalid upon a break above the bearish trend line at Friday’s high at 1.4580. If seen, a rally towards the 200 MA could be the outcome.
From time to time, StoneX Financial Pty Ltd (“we”, “our”) website may contain links to other sites and/or resources provided by third parties. These links and/or resources are provided for your information only and we have no control over the contents of those materials, and in no way endorse their content. Any analysis, opinion, commentary or research-based material on our website is for information and educational purposes only and is not, in any circumstances, intended to be an offer, recommendation or solicitation to buy or sell. You should always seek independent advice as to your suitability to speculate in any related markets and your ability to assume the associated risks, if you are at all unsure. No representation or warranty is made, express or implied, that the materials on our website are complete or accurate. We are not under any obligation to update any such material.
As such, we (and/or our associated companies) will not be responsible or liable for any loss or damage incurred by you or any third party arising out of, or in connection with, any use of the information on our website (other than with regards to any duty or liability that we are unable to limit or exclude by law or under the applicable regulatory system) and any such liability is hereby expressly disclaimed.
City Index is a trading name of StoneX Financial Pty Ltd.
The material provided herein is general in nature and does not take into account your objectives, financial situation or needs.
While every care has been taken in preparing this material, we do not provide any representation or warranty (express or implied) with respect to its completeness or accuracy. This is not an invitation or an offer to invest nor is it a recommendation to buy or sell investments.
StoneX recommends you to seek independent financial and legal advice before making any financial investment decision. Trading CFDs and FX on margin carries a higher level of risk, and may not be suitable for all investors. The possibility exists that you could lose more than your initial investment further CFD investors do not own or have any rights to the underlying assets.
It is important you consider our Financial Services Guide and Product Disclosure Statement (PDS) available at www.cityindex.com/en-au/terms-and-policies/, before deciding to acquire or hold our products. As a part of our market risk management, we may take the opposite side of your trade. Our Target Market Determination (TMD) is also available at www.cityindex.com/en-au/terms-and-policies/.
StoneX Financial Pty Ltd, Suite 28.01, 264 George Street, Sydney, NSW 2000 (ACN 141 774 727, AFSL 345646) is the CFD issuer and our products are traded off exchange.
© City Index 2024