dow jones arrives at key juncture 2655702016
Today is the second last trading day of the week for stocks ahead of the Easter break, and there’s little further data to provide significant direction. The focus will be on the official weekly US oil inventories data later today. Stockpiles have been rising relentlessly despite signs of lower oil output in recent months. Last night, the American Petroleum Institute (API), an industry group, again reported a sharp build of 8.8 million barrels for the prior week. This was much higher than expected, although it didn’t cause a notable decline in oil prices. However, if confirmed by the official data from the Energy Information Administration (EIA) later this afternoon then this could pressurise oil prices, which in turn may have an impact on commodity stocks. But it should be noted that during this time of the year when refineries carry out their maintenance works ahead of the driving season, inventories do tend to rise. Thus, a bigger surprise would be if we see a drawdown, or even a small build. In this case, oil and possibly stocks could extend their recent gains. The other key US data to watch for the remainder of this week includes durable goods orders tomorrow and the final GDP estimate on Friday. From Europe, this week’s key remaining data includes the German Gfk Consumer Climate survey and the ECB’s Target LTRO results, both tomorrow. The start of next week will also be a slow one as far as the economic calendar is concerned, but things should pick up later on in the week with the monthly US jobs report scheduled for release on Friday April 1.
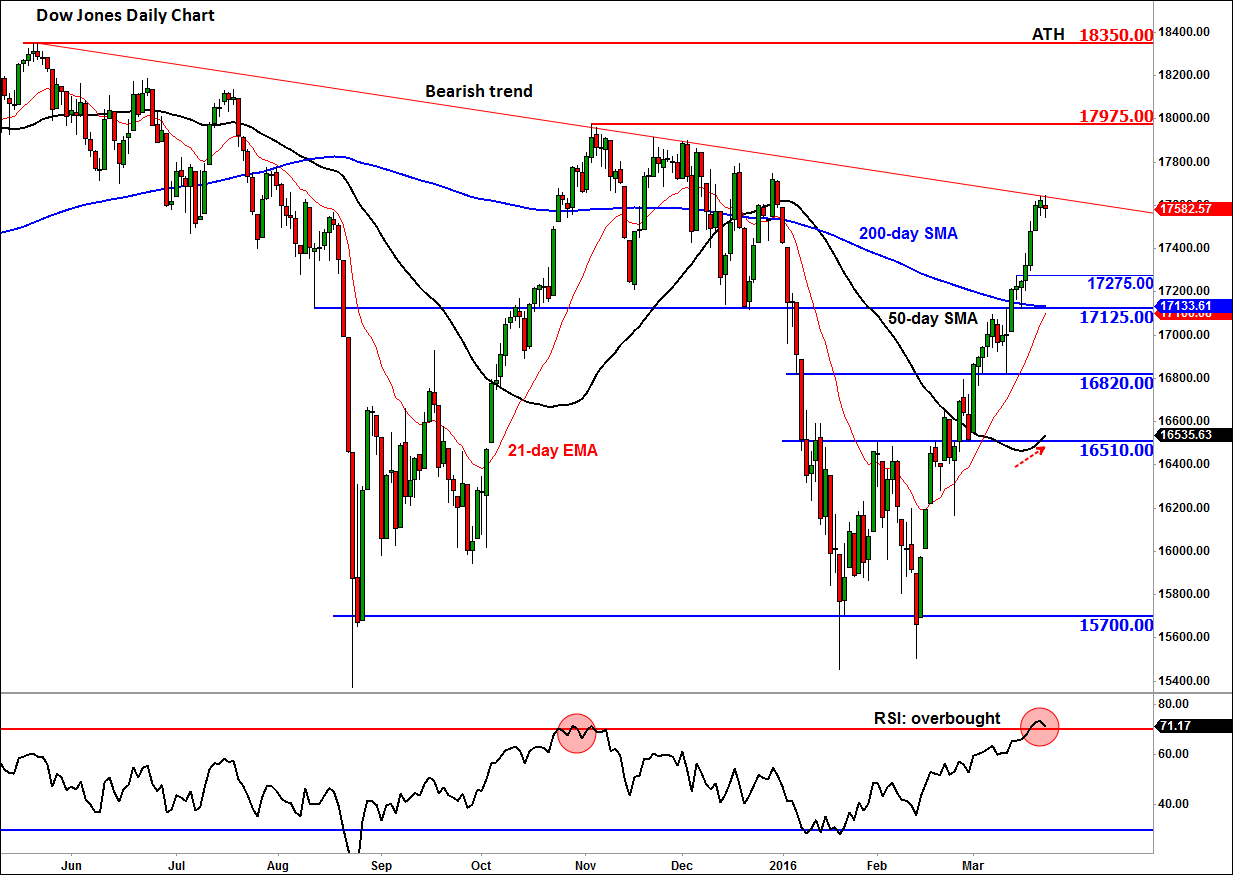
Because of the lack of significant data in the interim, technical analysis will garner more attention than usual, especially as the lower expected volumes over the coming days should make the markets more vulnerable to sharp moves and more headline-driven. On this front, the daily chart of the Dow Jones Industrial Average is an interesting to watch. It has been the best performing US index this year, undoubtedly due to the performance of the commodity stocks (as a result of rallying oil prices) that make up a large portion of this index. And overall the market conditions are favourable for the bulls, given the extremely low and negative interest rates as well as other nonconventional stimulus measures such as quantitative easing from some of the major central banks.
But a short-term pullback looks likely now that the Dow has reached a key level around the 17640/50 area, which corresponds with a bearish trend line off the previous record high, while the RSI momentum indicator has climbed above the “overbought” threshold of 70. So, there is potential for a pullback here, in part due to profit-taking from the longs. The sellers are only likely to show up in force if and when the index forms a reversal-looking candlestick pattern on the higher time frames such as the daily chart.
However, the bulls would argue that a pullback at this stage would actually be a positive outcome as it would allow the oscillators to work off ‘overbought’ conditions. The 50-day moving average is pointing higher and the 200 is flattening. So we could see a short-term pullback, potentially towards support levels at 17275 or 17125, before the rally resumes. Otherwise, a continuation of the rally towards the early November high at 17975 could be likely. The bulls may wish to proceed with extra caution over the next several days while the bears need to wait for some confirmation.
From time to time, StoneX Financial Pty Ltd (“we”, “our”) website may contain links to other sites and/or resources provided by third parties. These links and/or resources are provided for your information only and we have no control over the contents of those materials, and in no way endorse their content. Any analysis, opinion, commentary or research-based material on our website is for information and educational purposes only and is not, in any circumstances, intended to be an offer, recommendation or solicitation to buy or sell. You should always seek independent advice as to your suitability to speculate in any related markets and your ability to assume the associated risks, if you are at all unsure. No representation or warranty is made, express or implied, that the materials on our website are complete or accurate. We are not under any obligation to update any such material.
As such, we (and/or our associated companies) will not be responsible or liable for any loss or damage incurred by you or any third party arising out of, or in connection with, any use of the information on our website (other than with regards to any duty or liability that we are unable to limit or exclude by law or under the applicable regulatory system) and any such liability is hereby expressly disclaimed.
City Index is a trading name of StoneX Financial Pty Ltd.
The material provided herein is general in nature and does not take into account your objectives, financial situation or needs.
While every care has been taken in preparing this material, we do not provide any representation or warranty (express or implied) with respect to its completeness or accuracy. This is not an invitation or an offer to invest nor is it a recommendation to buy or sell investments.
StoneX recommends you to seek independent financial and legal advice before making any financial investment decision. Trading CFDs and FX on margin carries a higher level of risk, and may not be suitable for all investors. The possibility exists that you could lose more than your initial investment further CFD investors do not own or have any rights to the underlying assets.
It is important you consider our Financial Services Guide and Product Disclosure Statement (PDS) available at www.cityindex.com/en-au/terms-and-policies/, before deciding to acquire or hold our products. As a part of our market risk management, we may take the opposite side of your trade. Our Target Market Determination (TMD) is also available at www.cityindex.com/en-au/terms-and-policies/.
StoneX Financial Pty Ltd, Suite 28.01, 264 George Street, Sydney, NSW 2000 (ACN 141 774 727, AFSL 345646) is the CFD issuer and our products are traded off exchange.
© City Index 2024