Daily Forex Technical Strategy Wed 21 Aug
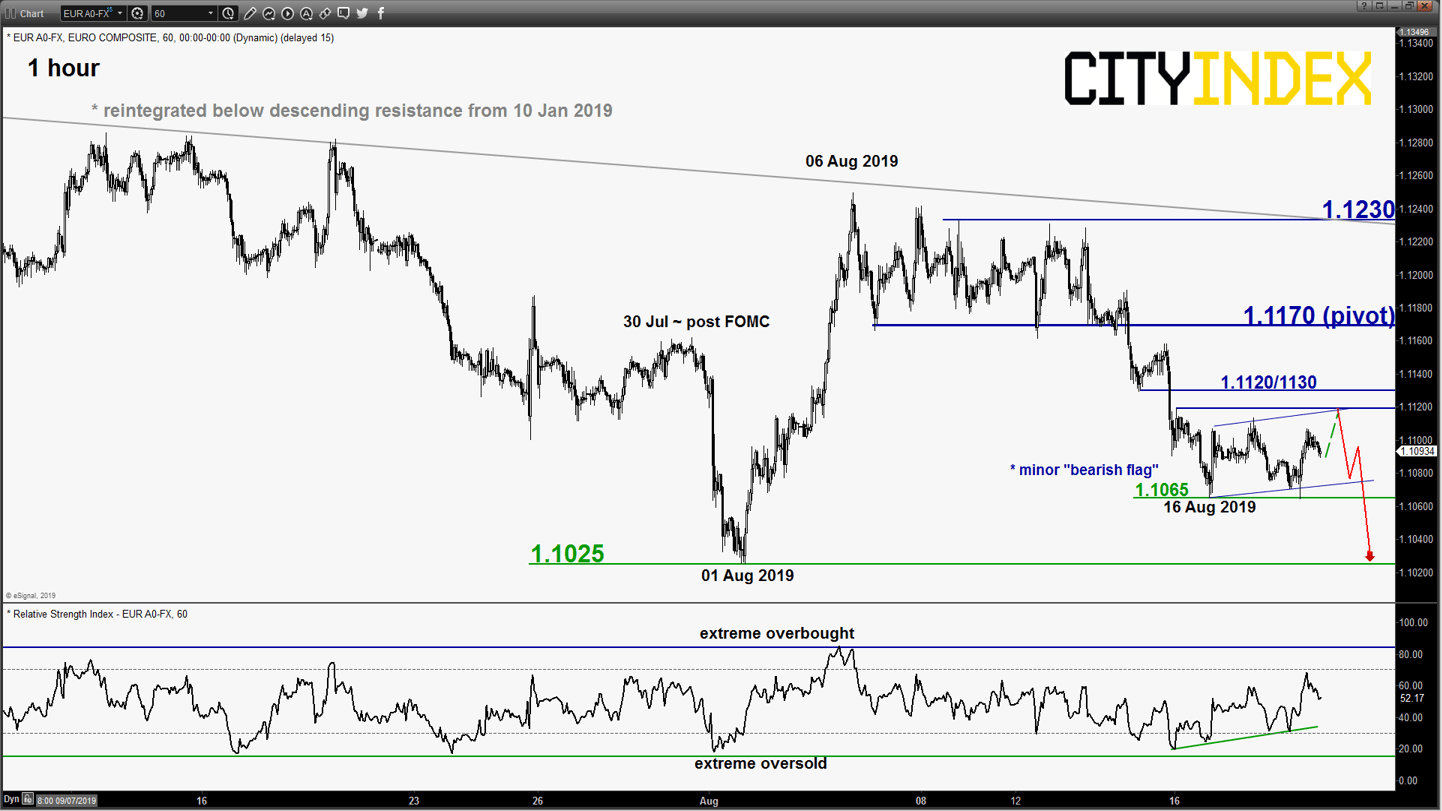
EUR/USD – Residual bounce before risk of new drop
click to enlarge chart
- The pair has shaped expected bounce within the minor “bearish flag” ascending range configuration in place since 16 Aug 2019. Rang top/resistance of the “bearish flag” remains at 1.1120/1130 (click here to recap our previous report).
- Maintain bearish bias in any bounces below 1.1170 key short-term pivotal resistance for another potential downleg to retest the 1.1025 near-term support in the first step.
- However, a clearance with an hourly close above 1.1170 negates the bearish tone for an extension of the corrective rebound towards the next resistance at 1.1230 (also the descending trendline from 10 Jan 2019 high).
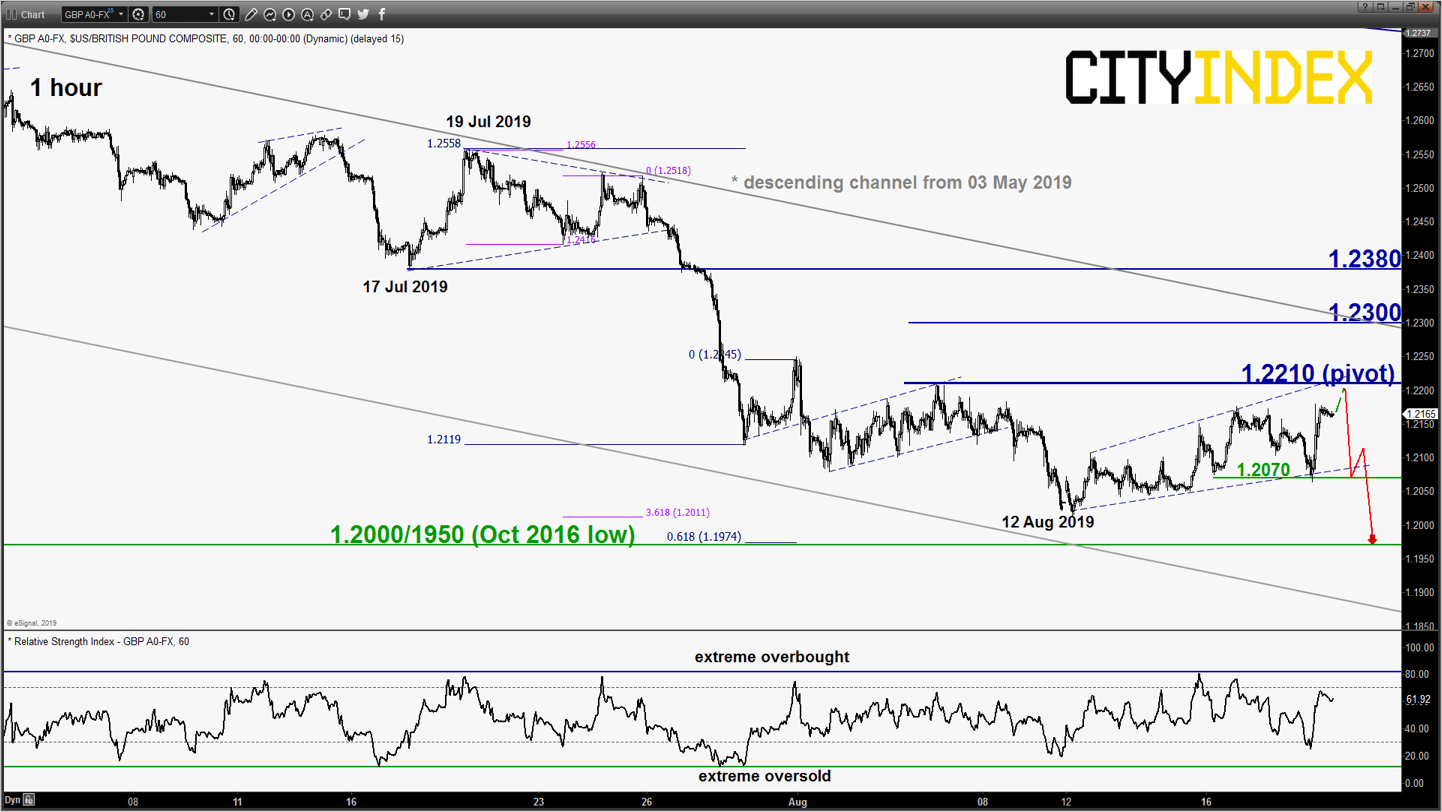
GBP/USD – 1.2210 remains the key resistance to watch
click to enlarge chart
- The pair pushed down, tested the 1.2095/2070 lower limit/support of a minor “Expanding Wedge” range configuration in place since 12 Aug 2019 before a bounce of 125 pips bounce to print a high of 1.2180 in yesterday’s U.S. session. The steep bounce came on the backdrop of potential “soft Brexit” revival after German Chancellor, Merkel commented that EU must think about practical solutions regarding the Irish backstop.
- The 1 -hour RSI oscillator is now coming close to an extreme overbought level. No change, maintain bearish bias with 1.2210 remains as the key short-term pivotal resistance (also the “Expanding Wedge” upper limit) for a potential push down to retest 1.2070 and a break below it may see a further drop to target the 1.2000/1950 support.
- However, a clearance with an hourly close above 1.2210 negates the bearish tone for an extended corrective rebound towards the medium-term descending channel resistance at 1.2300.
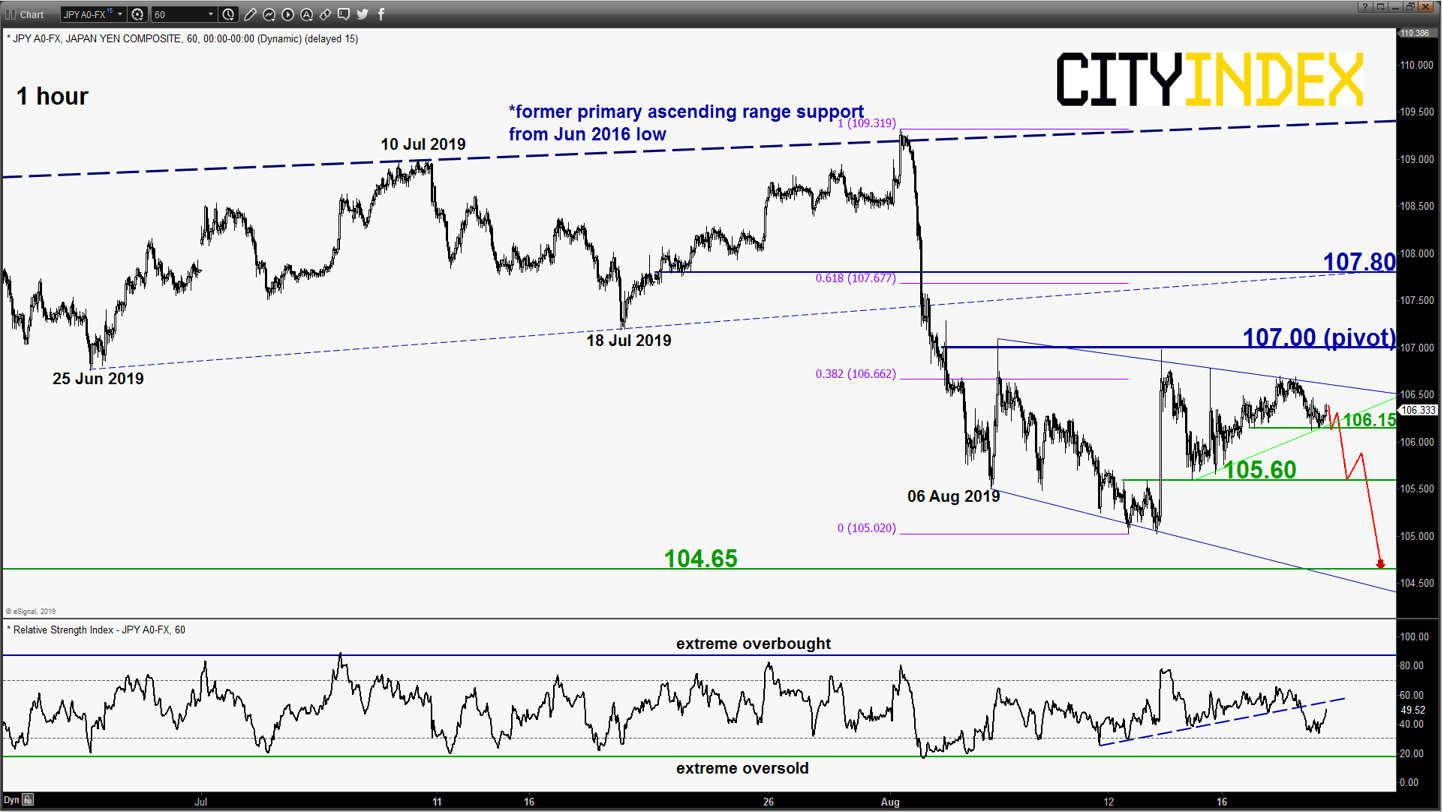
USD/JPY – Further potential downside below 107.00
click to enlarge chart
- The pair has staged the expected drift down from the upper limit/resistance of the minor “descending range” configuration in place since 06 Aug 2019. Tested the intermediate support at 106.15 and traded sideways thereafter.
- No change, maintain bearish bias below 107.00 key short-term pivotal resistance and a break below 106.15 is likely to see a potential drop towards 105.60 follow by 104.65 support (03 Jan 2019 flash crash low area & 22/23 Jan 2018 swing low). However, a clearance with an hourly close above 107.00 sees a squeeze up towards 107.80.
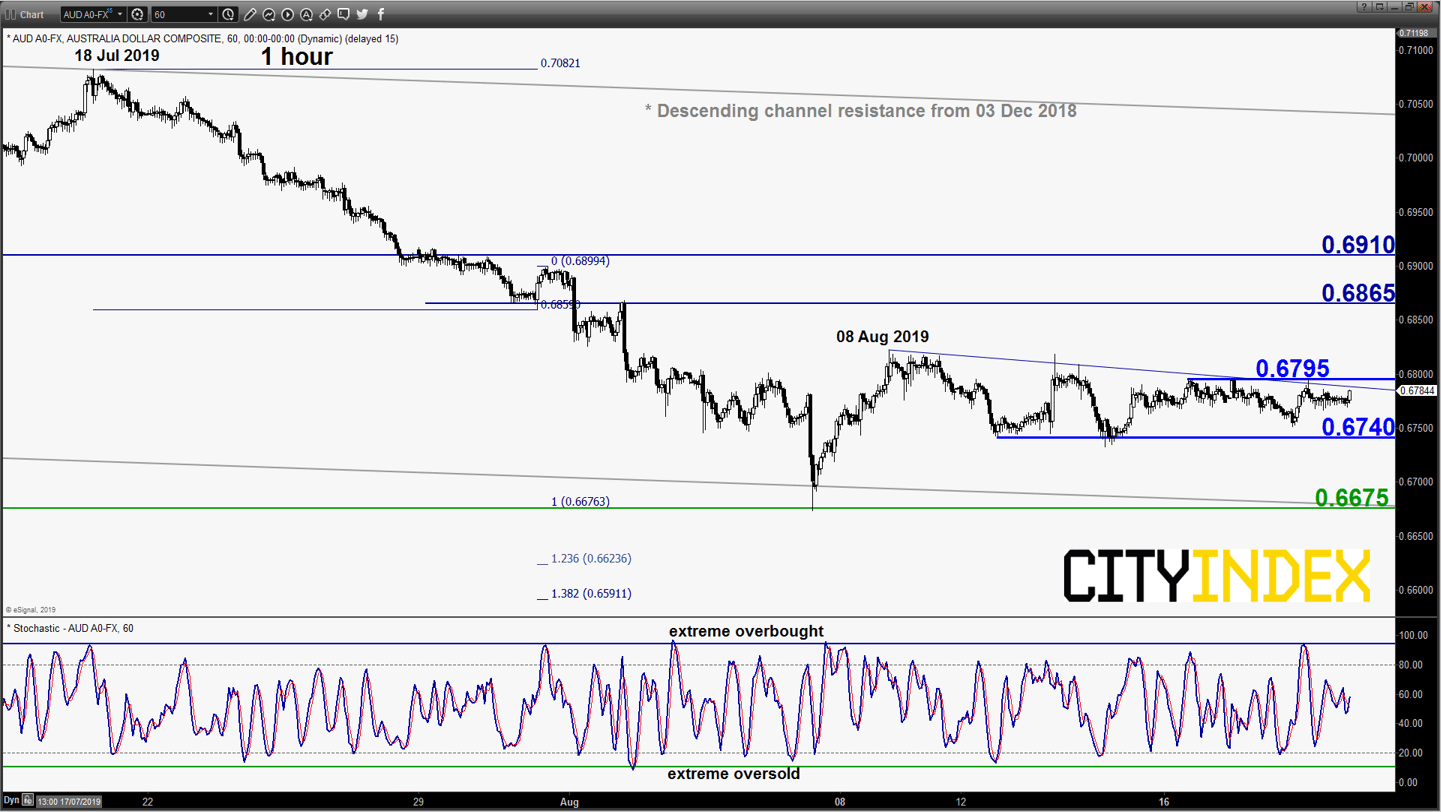
AUD/USD – Stuck inside a range configuration
click to enlarge chart
- Since its 08 Aug 2019 high of 0.6822, the pair has started to evolve within a minor “triangle” range configuration with upper and lower limits at 0.6795 and 0.6740 respectively.
- No change, maintain neutral stance between 0.6795 and 0.6740. Only an hourly close above 0.6795 validates a potential corrective rebound towards the next intermediate resistance at 0.6865. On the flipside, a break above 0.6795 sees an extension of the corrective rebound towards the next resistance at 0.6865 (also close to the 50% Fibonacci retracement of the recent steep decline from 18 Jul high to 07 Aug 2019 low).
Charts are from eSignal
From time to time, StoneX Financial Pty Ltd (“we”, “our”) website may contain links to other sites and/or resources provided by third parties. These links and/or resources are provided for your information only and we have no control over the contents of those materials, and in no way endorse their content. Any analysis, opinion, commentary or research-based material on our website is for information and educational purposes only and is not, in any circumstances, intended to be an offer, recommendation or solicitation to buy or sell. You should always seek independent advice as to your suitability to speculate in any related markets and your ability to assume the associated risks, if you are at all unsure. No representation or warranty is made, express or implied, that the materials on our website are complete or accurate. We are not under any obligation to update any such material.
As such, we (and/or our associated companies) will not be responsible or liable for any loss or damage incurred by you or any third party arising out of, or in connection with, any use of the information on our website (other than with regards to any duty or liability that we are unable to limit or exclude by law or under the applicable regulatory system) and any such liability is hereby expressly disclaimed.
City Index is a trading name of StoneX Financial Pty Ltd.
The material provided herein is general in nature and does not take into account your objectives, financial situation or needs.
While every care has been taken in preparing this material, we do not provide any representation or warranty (express or implied) with respect to its completeness or accuracy. This is not an invitation or an offer to invest nor is it a recommendation to buy or sell investments.
StoneX recommends you to seek independent financial and legal advice before making any financial investment decision. Trading CFDs and FX on margin carries a higher level of risk, and may not be suitable for all investors. The possibility exists that you could lose more than your initial investment further CFD investors do not own or have any rights to the underlying assets.
It is important you consider our Financial Services Guide and Product Disclosure Statement (PDS) available at www.cityindex.com/en-au/terms-and-policies/, before deciding to acquire or hold our products. As a part of our market risk management, we may take the opposite side of your trade. Our Target Market Determination (TMD) is also available at www.cityindex.com/en-au/terms-and-policies/.
StoneX Financial Pty Ltd, Suite 28.01, 264 George Street, Sydney, NSW 2000 (ACN 141 774 727, AFSL 345646) is the CFD issuer and our products are traded off exchange.
© City Index 2024