Cushing data boosts oil price
It’s been a relatively subdued session this morning in Asia. Even the release of the second edition of the Australian Bureau of Statistics (ABS) weekly jobs data that implies almost 1 million Australians have lost their jobs, failed to imprint on the AUDUSD.
Possibly supporting the AUDUSD and other risk assets was a comment from Deputy national security adviser Matthew Pottinger, that the United States was not considering ‘punitive measures’ against China over its handling of the coronavirus, contradicting previous comments from the Trump administration.
Also supporting risk sentiment, a further stabilisation in key commodity prices overnight as the front month (June) West Texas Intermediate oil futures contract closed back above U.S$20/bbl.
More importantly, the July futures contract which is where most of the volume is now going through as traders look to avoid a repeat of last month’s chaotic price action into the expiry of the May contract, closed at U.S$22.78 /bbl and is trading another 5.79% higher today, at U.S$24.09/bbl.
The catalyst for the rally, news that inventories at Cushing (the largest oil-storage tank farm in the world and responsible for about 13% of total U.S. storage) rose only 1.88mb last week, the smallest increase since mid-March, providing encouraging signs that the required rebalancing between supply and demand is now underway.
Attention now turns to tomorrow morning's API data (6.30 am Sydney time) and the official EIA data due early Thursday morning.
Given the strong correlation between Cushing numbers and the EIA’s reports, this week could see the earliest confirmation that a medium term low is in place for oil and that a modest recovery is underway.
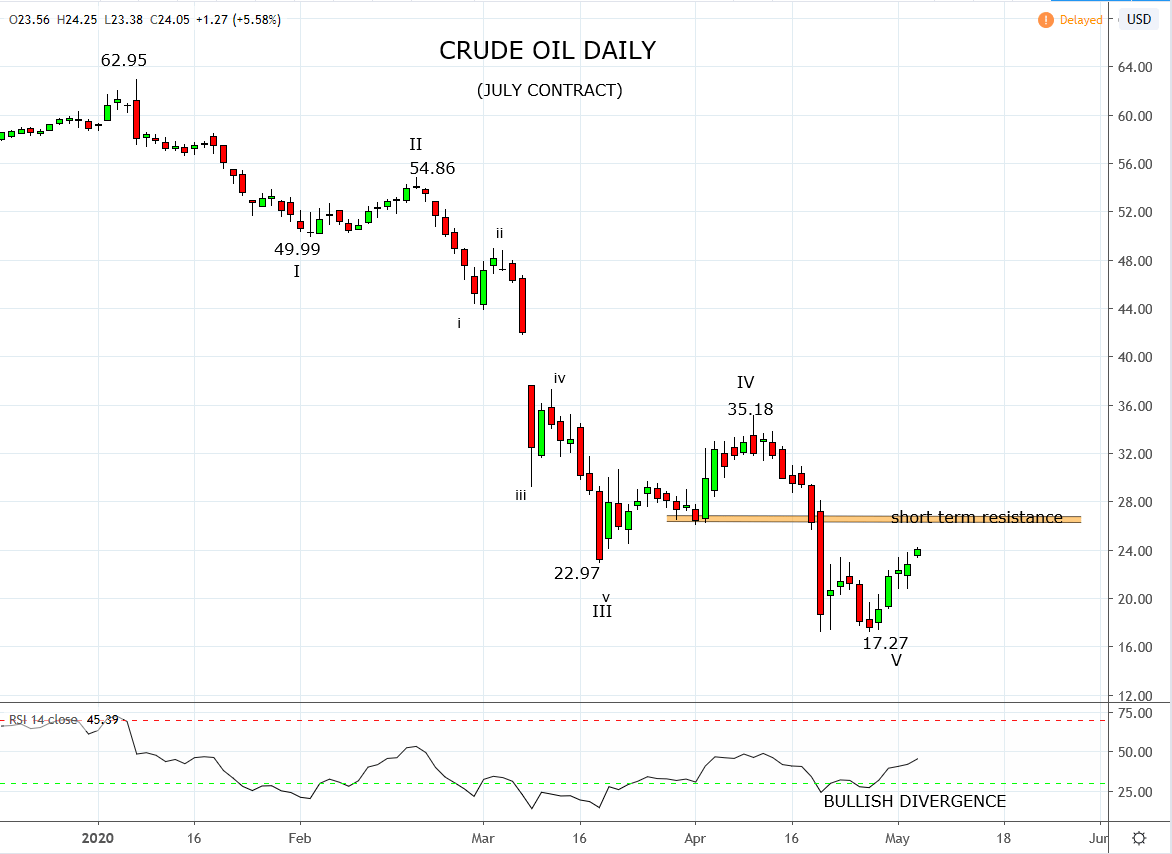
The technical picture is supportive of this idea. As can be seen on the chart below there is a five-wave decline in place from the U.S$62.95 high to last month's U.S$17.27 low. After a 5 wave decline, a countertrend rally is expected and this idea is supported by the emergence of bullish divergence via the RSI indicator at the U.S$17.27 low.
In summary, while medium term support at U.S$17.27 holds basis the July contract, allow for prices to make further gains towards short term resistance U.S$26.40/50 region.
Source Tradingview. The figures stated areas of the 5th of May 2020. Past performance is not a reliable indicator of future performance. This report does not contain and is not to be taken as containing any financial product advice or financial product recommendation
From time to time, StoneX Financial Pty Ltd (“we”, “our”) website may contain links to other sites and/or resources provided by third parties. These links and/or resources are provided for your information only and we have no control over the contents of those materials, and in no way endorse their content. Any analysis, opinion, commentary or research-based material on our website is for information and educational purposes only and is not, in any circumstances, intended to be an offer, recommendation or solicitation to buy or sell. You should always seek independent advice as to your suitability to speculate in any related markets and your ability to assume the associated risks, if you are at all unsure. No representation or warranty is made, express or implied, that the materials on our website are complete or accurate. We are not under any obligation to update any such material.
As such, we (and/or our associated companies) will not be responsible or liable for any loss or damage incurred by you or any third party arising out of, or in connection with, any use of the information on our website (other than with regards to any duty or liability that we are unable to limit or exclude by law or under the applicable regulatory system) and any such liability is hereby expressly disclaimed.
City Index is a trading name of StoneX Financial Pty Ltd.
The material provided herein is general in nature and does not take into account your objectives, financial situation or needs.
While every care has been taken in preparing this material, we do not provide any representation or warranty (express or implied) with respect to its completeness or accuracy. This is not an invitation or an offer to invest nor is it a recommendation to buy or sell investments.
StoneX recommends you to seek independent financial and legal advice before making any financial investment decision. Trading CFDs and FX on margin carries a higher level of risk, and may not be suitable for all investors. The possibility exists that you could lose more than your initial investment further CFD investors do not own or have any rights to the underlying assets.
It is important you consider our Financial Services Guide and Product Disclosure Statement (PDS) available at www.cityindex.com/en-au/terms-and-policies/, before deciding to acquire or hold our products. As a part of our market risk management, we may take the opposite side of your trade. Our Target Market Determination (TMD) is also available at www.cityindex.com/en-au/terms-and-policies/.
StoneX Financial Pty Ltd, Suite 28.01, 264 George Street, Sydney, NSW 2000 (ACN 141 774 727, AFSL 345646) is the CFD issuer and our products are traded off exchange.
© City Index 2024