counting brexit costs construction output drops at fastest pace since 2009 2668832016
It has now been just over a week since the EU referendum resulted in a shock exit outcome which caused the pound and stock markets to plunge. While UK and global equities have since roared back, due, in part, to “bargain hunting,” surging commodity prices and the promise of more stimulus from central banks, question marks remain over the ability of the markets to sustain their gains. Meanwhile, the pound has remained near its post-Brexit lows. Investors clearly now expect the Bank of England to either cut interest rates further and/or expand QE in an attempt to counteract the potential near-term negative implications on the UK economy of Brexit. The central bank’s next meeting on 14 July will therefore be among the most closely-followed for a good few years. But underscoring the Brexit worries, fresh data has today revealed that the UK’s construction industry endured its worst performance for seven years in June, while investor sentiment in the Eurozone fell to its lowest level since November 2014. Adding insult to injury, the ratings agency Standard & Poor’s (S&P) has warned that the UK economy will “barely escape full-fledged recession.”
Homebuilders tank, miners jump
Unsurprisingly, stocks in the construction sector, banks and retailers were among the worst hit on the London stock exchange this morning, with British Land Company and Land Securities, for example, dropping 5% each. The domestically-focused FTSE 250 index was down some 1.6 per cent at the time of this writing. Nevertheless, the more closely-followed FTSE 100 index was barely in the red, supported by rallying miners with Fresnillo being some 7% higher after silver prices surged to above $21 per troy ounce in overnight trading. Despite this, it looks like the rally for the European stock markets have at least paused for now. With the US markets closed in observance of Independence Day, it is difficult to see how the markets will be able to turn things around in the afternoon. Instead, profit taking from last week’s long positions may see the FTSE 100 and the wider European markets ease further.
Economic data woeful
There’s nothing significant left on the economic calendar either for the rest of the day today. Earlier, the closely-watched Markit/CIPS UK Construction Purchasing Managers’ Index (PMI) came in below the boom/bust level of 50 for the month of June. At 46.0, the UK construction sector PMI had its worst showing since June 2009. It was down sharply from 51.2 recorded in May and needless to say, it easily missed expectations for a reading of 50.6. Meanwhile, Sentix reported that its index which tracks economic expectations for the Eurozone economy has dropped from June’s +10 points to -2 points in July, which marks the lowest reading since November 2014. The Frankfurt-based research group’s headline index also declined sharply, to +1.7 from +9.9 points previously.
US Jobs report on Friday
Looking forward to the rest of the week, there will be a few important data releases and some retail-focused companies that will be either reporting their results or providing trading updates in the UK, so the focus will not be entirely on the issue of Brexit and the Conservative leadership race. Among the highlights, Sports Direct will be reporting its earnings while Marks & Spencer and Associated British Foods will be publishing their trading statements, all on Thursday. A day later, on Friday, the US June jobs report is scheduled for publication. This is unlikely to cause any major shifts in expectations about US interest rates, but a surprising large beat or a miss could nevertheless shake the markets.
Technical outlook: FTSE 100
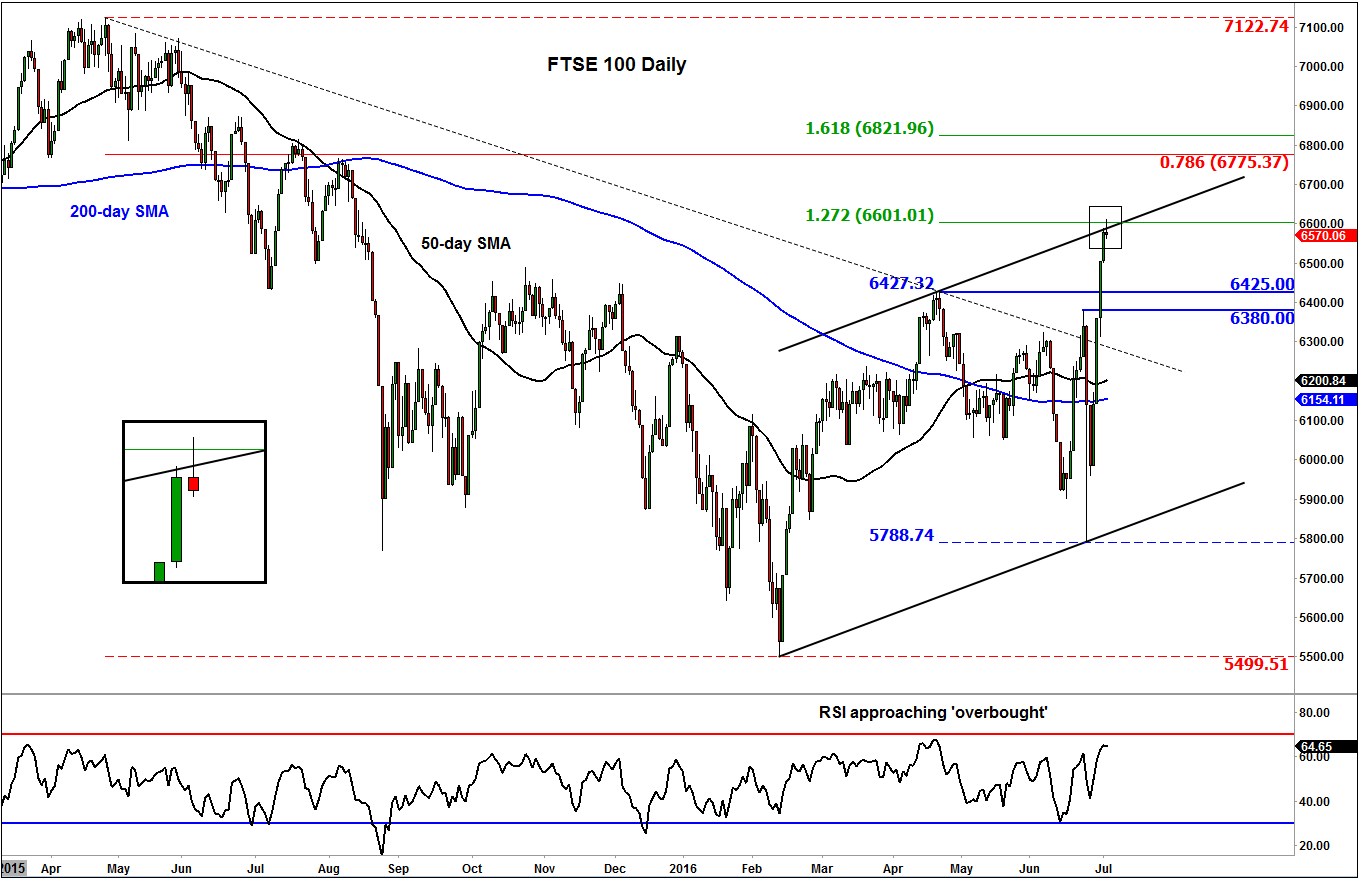
As far as the FTSE 100 is concerned, last week’s massive rally has lifted the RSI near the overbought levels of 70. The underlying index itself has reached the top of its newly-established bullish channel, so a pause in the upward trend should be expected here, which may actually not be a bad thing as far as the bullish trend is concerned. Nevertheless, we now expect the dips to be faded with shallow, rather than deep, corrections. As such, traders should watch price action closely around key support levels such as 6425 and 6380, levels which were previously resistance. Meanwhile there are not many obvious resistance levels to watch in close proximity. But at the top of the bullish channel sits the 127.2% extension level of the prior downswing at 6600 which is holding the index down as I write this. But given the strength of the rally, this level will probably be unable to hold the FTSE down for too long. A stronger Fibonacci-based resistance level could therefore be the 161.8% extension of this move at 6820/2 area or the 78.6% retracement against the all-time high at 6775.
From time to time, StoneX Financial Pty Ltd (“we”, “our”) website may contain links to other sites and/or resources provided by third parties. These links and/or resources are provided for your information only and we have no control over the contents of those materials, and in no way endorse their content. Any analysis, opinion, commentary or research-based material on our website is for information and educational purposes only and is not, in any circumstances, intended to be an offer, recommendation or solicitation to buy or sell. You should always seek independent advice as to your suitability to speculate in any related markets and your ability to assume the associated risks, if you are at all unsure. No representation or warranty is made, express or implied, that the materials on our website are complete or accurate. We are not under any obligation to update any such material.
As such, we (and/or our associated companies) will not be responsible or liable for any loss or damage incurred by you or any third party arising out of, or in connection with, any use of the information on our website (other than with regards to any duty or liability that we are unable to limit or exclude by law or under the applicable regulatory system) and any such liability is hereby expressly disclaimed.
City Index is a trading name of StoneX Financial Pty Ltd.
The material provided herein is general in nature and does not take into account your objectives, financial situation or needs.
While every care has been taken in preparing this material, we do not provide any representation or warranty (express or implied) with respect to its completeness or accuracy. This is not an invitation or an offer to invest nor is it a recommendation to buy or sell investments.
StoneX recommends you to seek independent financial and legal advice before making any financial investment decision. Trading CFDs and FX on margin carries a higher level of risk, and may not be suitable for all investors. The possibility exists that you could lose more than your initial investment further CFD investors do not own or have any rights to the underlying assets.
It is important you consider our Financial Services Guide and Product Disclosure Statement (PDS) available at www.cityindex.com/en-au/terms-and-policies/, before deciding to acquire or hold our products. As a part of our market risk management, we may take the opposite side of your trade. Our Target Market Determination (TMD) is also available at www.cityindex.com/en-au/terms-and-policies/.
StoneX Financial Pty Ltd, Suite 28.01, 264 George Street, Sydney, NSW 2000 (ACN 141 774 727, AFSL 345646) is the CFD issuer and our products are traded off exchange.
© City Index 2024