Can Google Alphabet break new high on the third attempt
Alphabet Inc, the holding company of Google will report its Q3 2019 earnings on Mon, 28 Oct after the close of the U.S. session. Consensus adjusted EPS and revenue forecasts are pegged at $14.59 and $23.72bn respectively. My colleague, Ken Odeluga has written an earnings preview report earlier (click here for a recap).
We will now decipher the share price of Alphabet from a technical analysis perspective.
Medium-term technical outlook on Alphabet (GOOGL)
click to enlarge charts
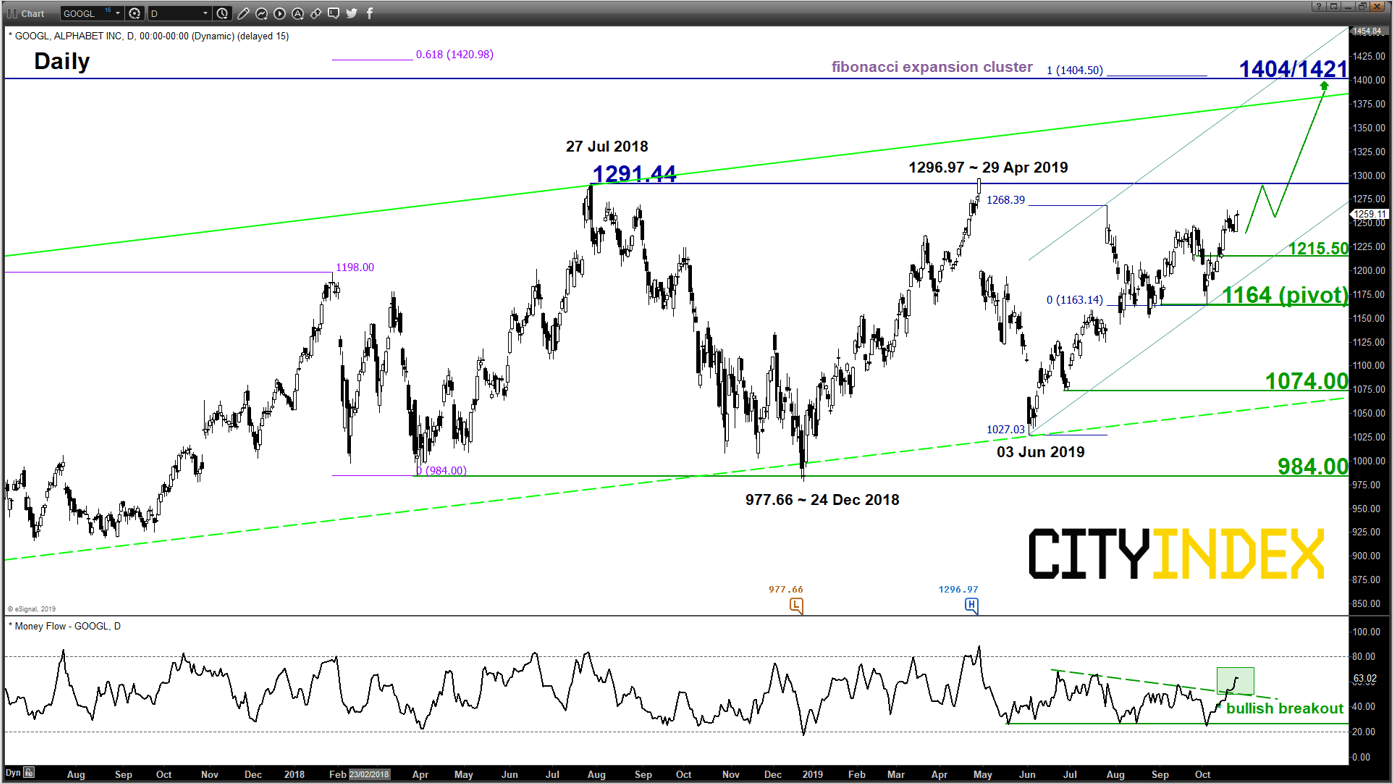
Key Levels (1 to 3 weeks)
Intermediate support: 1215.50
Pivot (key support): 1164
Resistances: 1291.44 & 1404/1421
Next support: 1074
Directional Bias (1 to 3 weeks)
Bullish bias in any dips above 1164 key medium-term pivotal support and a clearance above 1291.44 is likely to open up scope for another potential impulsive upleg sequence to target the next significant major resistance zone at 1404/1421.
On the other hand, a break with a daily close below 1164 put the bullish tone on hold for a corrective slide to retest the upper limit of a major support zone at 1074.00 (the median line of a long-term secular ascending channel from Aug 2004 low & 76.4% Fibonacci retracement of the up move from 03 Jun low to 26 Jul 2019 high.
Key elements
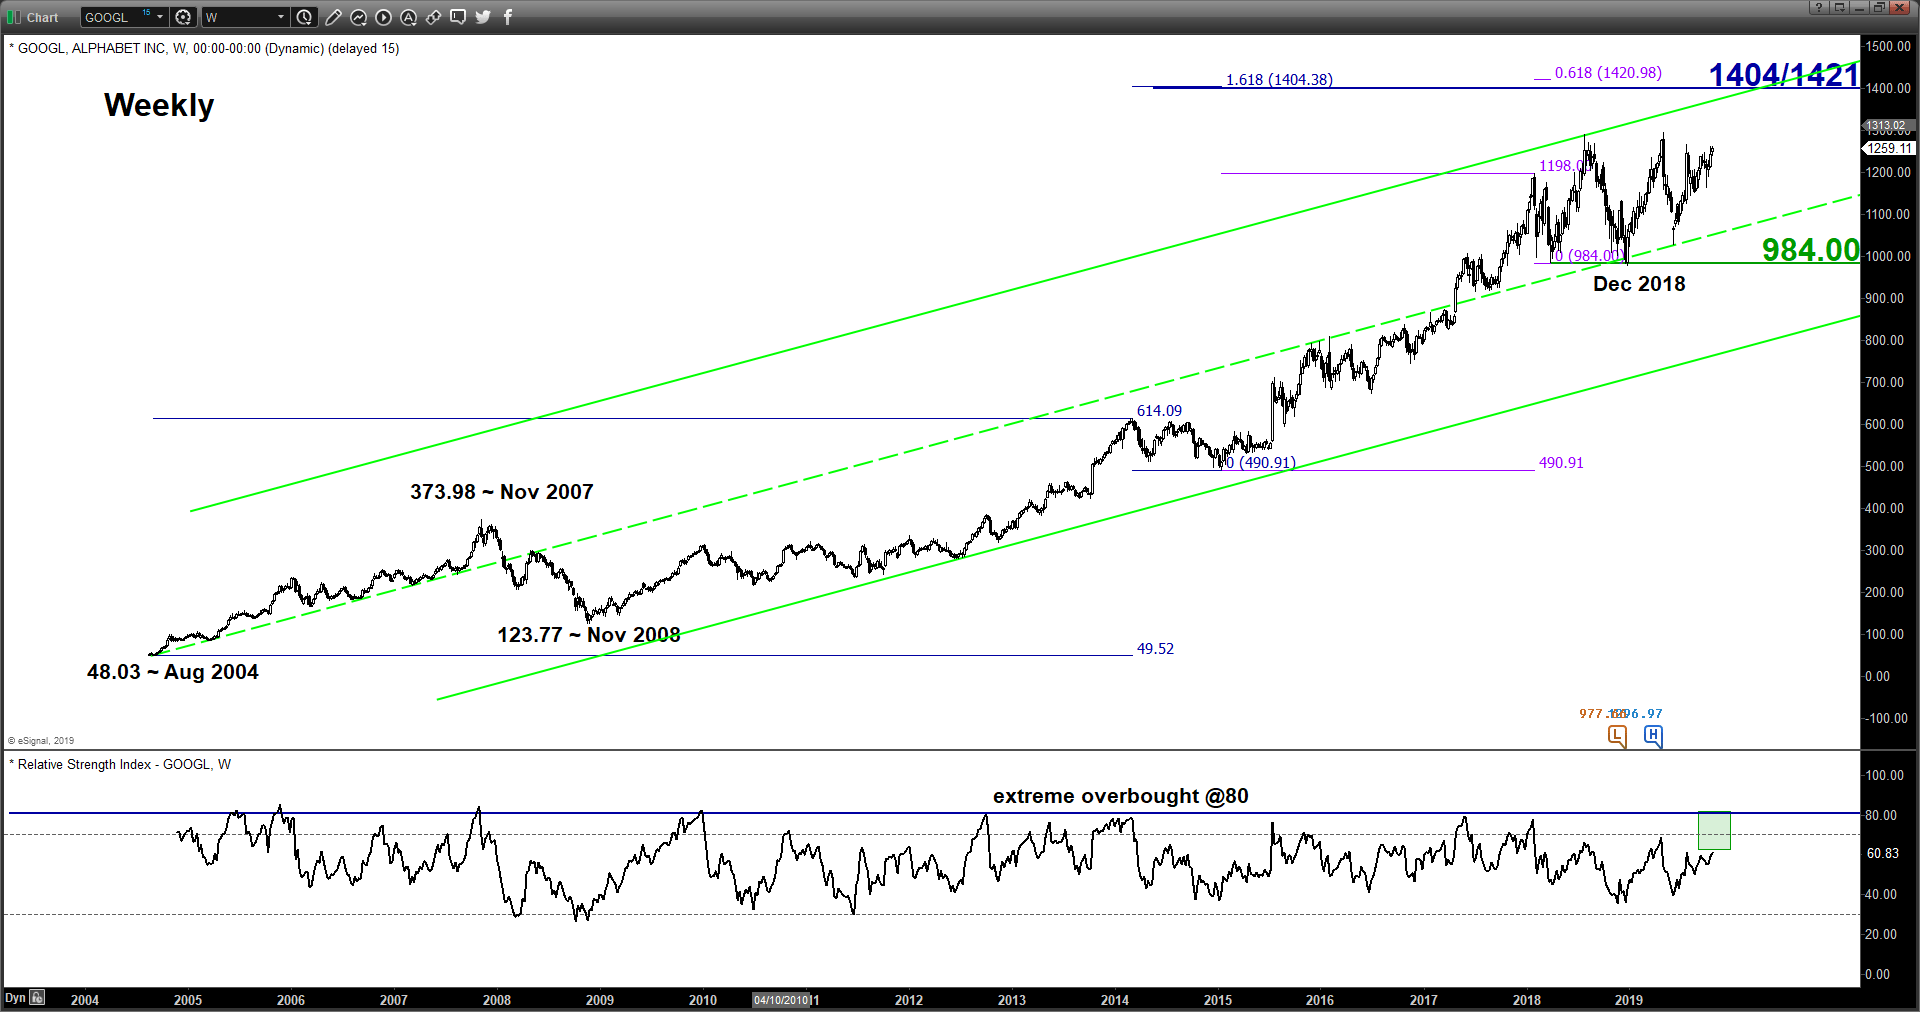
- The weekly RSI oscillator has continued to inch upwards since Jun 2019 and still has room to manoeuvre to the upside before it reaches an extreme overbought level at 80.
- The daily Money Flow Index (MFI) has staged a bullish breakout and has not reached its overbought region where its measurement is derived from a combination of price action and volume. Thus, observations from RSI and MFI suggest that both volume and upside momentum has started to pick up which supports a potential bullish breakout from its 15-month range configuration in place since 27 Jul 2018.
- Relative strength analysis against the market (S&P) and its sector (Communication Services) as infer from the ratio charts (refer to the last chart) are suggesting potential outperformance of Google/Alphabet against its Communication Services sector.
- The major resistance zone of 1404/1421 is defined by the upper boundary of the long-term secular ascending channel that confluences with upper boundary of the medium-term ascending channel from 03 Jun 2019 low and a Fibonacci expansion cluster.
Charts are from eSignal
From time to time, StoneX Financial Pty Ltd (“we”, “our”) website may contain links to other sites and/or resources provided by third parties. These links and/or resources are provided for your information only and we have no control over the contents of those materials, and in no way endorse their content. Any analysis, opinion, commentary or research-based material on our website is for information and educational purposes only and is not, in any circumstances, intended to be an offer, recommendation or solicitation to buy or sell. You should always seek independent advice as to your suitability to speculate in any related markets and your ability to assume the associated risks, if you are at all unsure. No representation or warranty is made, express or implied, that the materials on our website are complete or accurate. We are not under any obligation to update any such material.
As such, we (and/or our associated companies) will not be responsible or liable for any loss or damage incurred by you or any third party arising out of, or in connection with, any use of the information on our website (other than with regards to any duty or liability that we are unable to limit or exclude by law or under the applicable regulatory system) and any such liability is hereby expressly disclaimed.
City Index is a trading name of StoneX Financial Pty Ltd.
The material provided herein is general in nature and does not take into account your objectives, financial situation or needs.
While every care has been taken in preparing this material, we do not provide any representation or warranty (express or implied) with respect to its completeness or accuracy. This is not an invitation or an offer to invest nor is it a recommendation to buy or sell investments.
StoneX recommends you to seek independent financial and legal advice before making any financial investment decision. Trading CFDs and FX on margin carries a higher level of risk, and may not be suitable for all investors. The possibility exists that you could lose more than your initial investment further CFD investors do not own or have any rights to the underlying assets.
It is important you consider our Financial Services Guide and Product Disclosure Statement (PDS) available at www.cityindex.com/en-au/terms-and-policies/, before deciding to acquire or hold our products. As a part of our market risk management, we may take the opposite side of your trade. Our Target Market Determination (TMD) is also available at www.cityindex.com/en-au/terms-and-policies/.
StoneX Financial Pty Ltd, Suite 28.01, 264 George Street, Sydney, NSW 2000 (ACN 141 774 727, AFSL 345646) is the CFD issuer and our products are traded off exchange.
© City Index 2024