Burberry outlook survives Hong Kong
The unpredictable HK backdrop keeps guidance static despite a promising first half
Burberry shares are justifiably pricing back in profit expectations that were trimmed on worries over Hong Kong unrest and China growth. Britain’s leading purveyor of finery comfortably matched first-half 2020 sales expectations whilst pacing revenue and earnings forecasts, as sales accelerated in recent months.
Key H1/Q2 results
- Comparable H1 retail sales +4%, in line with estimates
- Comparable Q2 retail sales, +5% vs. +4.6% est.
- H1 revenue: £1.281bn vs. £1.26bn est.
- Comparable H1 operating profit: £186m vs. £172.3m est.
(Note H1 op. profit was £202m under recently adopted IFRS accounting standard)
Solid results partly reflect delivery on the promise of debut collections by chief designer Riccardo Tisci. Any doubt that a strong initial reception would hold into later quarters ought to have been softened given double-digit growth based in new products. Robust figures and firm demand overall demonstrate that anticipated disruption from unrest in Hong Kong was contained though the extent of its impact was still sobering. Burberry shares initially surged 9% on Thursday, their best one day move in four months. But the revelation in a post-earnings presentation that retail sales fell 38% in Hong Kong trimmed the rise to as little as 3.5%. With further “significant negative impact” expected in over Q3, the risks to full-year forecasts—which Burberry has maintained—can’t be ignored.
What’s positive about the HK situation is that the group doesn’t foresee further impairment charges there, after booking a £14m H1 hit, without details. More broadly, other key regions gave no fresh cause for alarm. And whilst currency impact and advantages from the new accounting format gave a non-operational lift, resilient demand still underpinned underlying profits. As well, the efficiency programme is on track for annual £135m savings targeted by 2022 with £110m in costs also intact.
The final impression is that the firm played its latest challenging hand adroitly, whilst the trump card of exclusive and rarefied designs is working out better than planned. True, old inventory continues to weigh on margins. And the verdict on the strength of new high-margin items (e.g. handbags) needs to be withheld till availability of Tisci’s collections reaches 80% of the ‘mainline’ offer from 70% in Q2. The buzzy Tencent alliance is just as difficult to quantify, though nice to have. It will neither hinder nor help Burberry with key challenges in the months ahead.
The positive though volatile stock reaction reflects improved stability but also continued uncertainty that the luxury group can escape its minnow status and also-ran valuation relative to European rivals anytime soon.
Chart points
Uptrend intact, the upside case continues to hinge on the difference between the cleanest trend of recent years, stemming from early September 2016, and peak resistance around 2340p-2360p. Investors must decide when or whether momentum will suffice on the share’s next attempt at the above highs, to surpass them. Sellers will have the opposite judgement to make. With the 200-week average now adding support to the dominant rising line, whilst RSI momentum also rallies with plenty of room to run, BRBY at least looks set to drift up towards another attempt at those highs as the year winds up.
Burberry Group Plc. CFD – Weekly
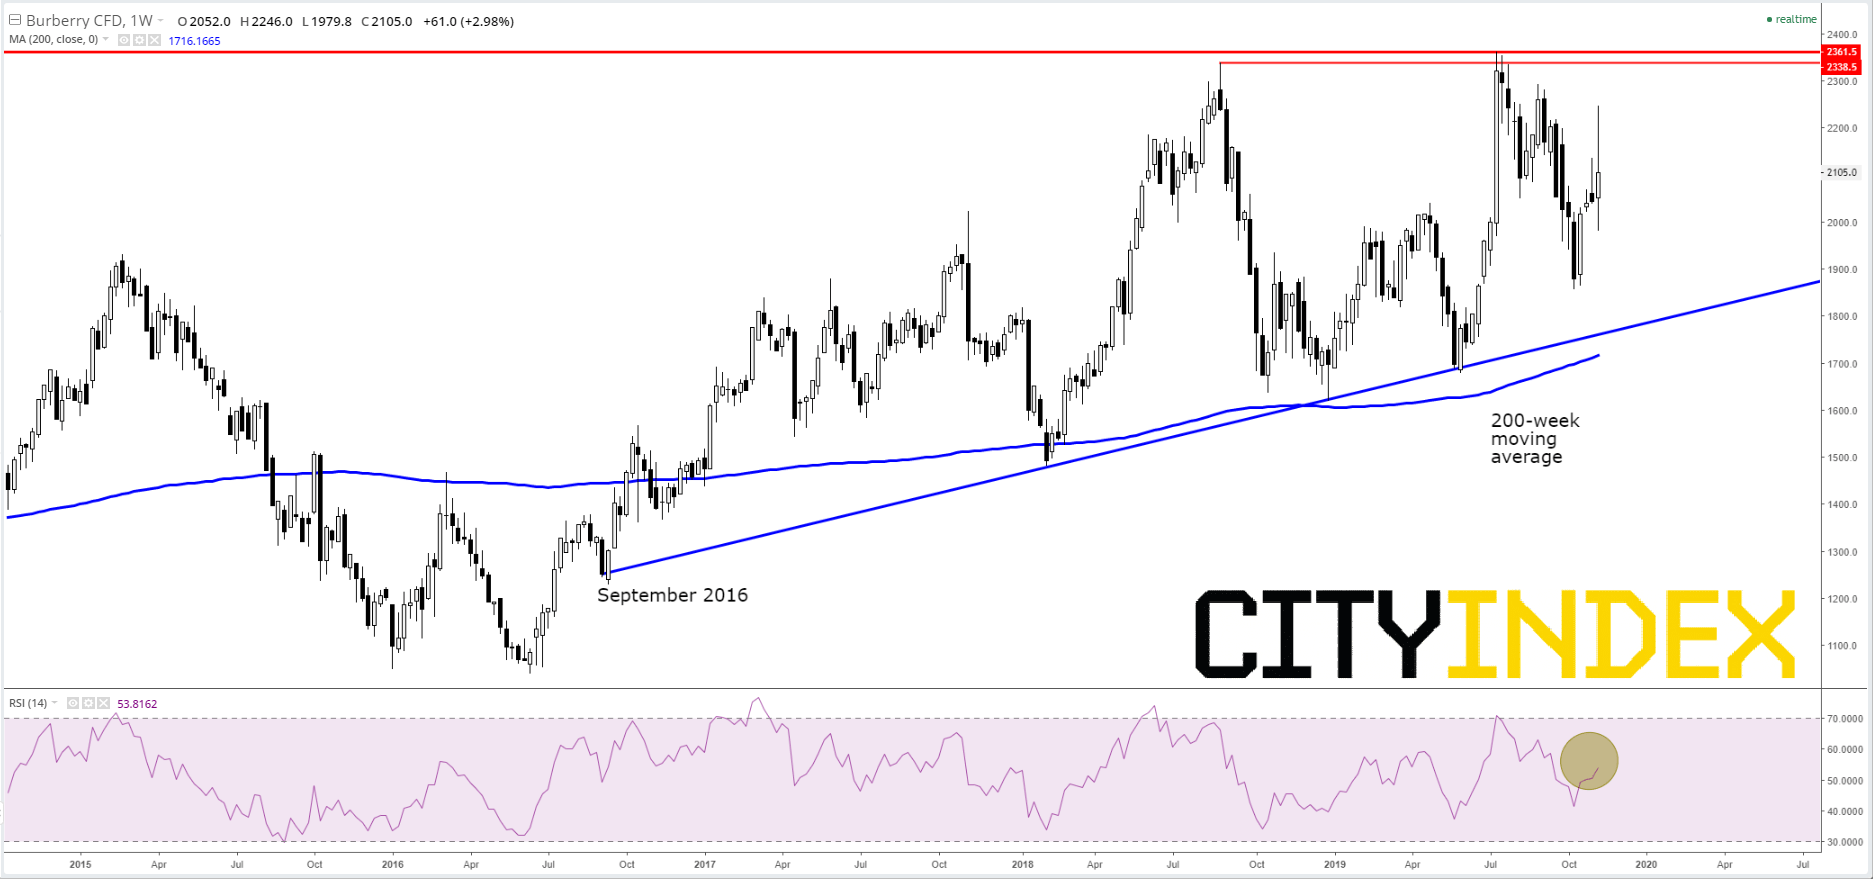
Source: City Index
From time to time, StoneX Financial Pty Ltd (“we”, “our”) website may contain links to other sites and/or resources provided by third parties. These links and/or resources are provided for your information only and we have no control over the contents of those materials, and in no way endorse their content. Any analysis, opinion, commentary or research-based material on our website is for information and educational purposes only and is not, in any circumstances, intended to be an offer, recommendation or solicitation to buy or sell. You should always seek independent advice as to your suitability to speculate in any related markets and your ability to assume the associated risks, if you are at all unsure. No representation or warranty is made, express or implied, that the materials on our website are complete or accurate. We are not under any obligation to update any such material.
As such, we (and/or our associated companies) will not be responsible or liable for any loss or damage incurred by you or any third party arising out of, or in connection with, any use of the information on our website (other than with regards to any duty or liability that we are unable to limit or exclude by law or under the applicable regulatory system) and any such liability is hereby expressly disclaimed.
City Index is a trading name of StoneX Financial Pty Ltd.
The material provided herein is general in nature and does not take into account your objectives, financial situation or needs.
While every care has been taken in preparing this material, we do not provide any representation or warranty (express or implied) with respect to its completeness or accuracy. This is not an invitation or an offer to invest nor is it a recommendation to buy or sell investments.
StoneX recommends you to seek independent financial and legal advice before making any financial investment decision. Trading CFDs and FX on margin carries a higher level of risk, and may not be suitable for all investors. The possibility exists that you could lose more than your initial investment further CFD investors do not own or have any rights to the underlying assets.
It is important you consider our Financial Services Guide and Product Disclosure Statement (PDS) available at www.cityindex.com/en-au/terms-and-policies/, before deciding to acquire or hold our products. As a part of our market risk management, we may take the opposite side of your trade. Our Target Market Determination (TMD) is also available at www.cityindex.com/en-au/terms-and-policies/.
StoneX Financial Pty Ltd, Suite 28.01, 264 George Street, Sydney, NSW 2000 (ACN 141 774 727, AFSL 345646) is the CFD issuer and our products are traded off exchange.
© City Index 2024