audjpy boj fed trigger risk on trade 2676722016
Traditional risk assets have surged higher over the past couple of days in reaction to the latest policy decisions from the Bank of Japan and the US Federal Reserve. Global equities, dollar-denominated metal and oil prices, the euro and commodity currencies have all benefited from this “risk-on” trade.
The stock market’s positive response clearly underscores investors’ faith that the era of low and negative interest rates, and QE, is far from over. Indeed, the Bank of Japan has promised to buy bonds until inflation overshoots its target, which could take several further years given that Japan is currently in deflation. The Bank of England and the European Central Bank have their own QE programmes ongoing at the moment. Even the Reserve Bank of New Zealand has strongly indicated that further rate cuts may be necessary. And although the Federal Reserve looks set to raise rates in December, it will most likely be a small increase and the tightening cycle a slow one. So monetary policy is likely to remain extremely accommodative across the board for the foreseeable future.
Against this backdrop, I can’t help but maintain my long-term bullish stance on the equity markets and, to a lesser degree, high beta and commodity currencies. The Australian dollar is one such currency. In recent times, the Aussie has indeed performed well, especially against currencies where the central bank is dovish, such as the pound and the euro. However, against the yen, it hasn’t performed as well, even though the Bank of Japan’s QE programme has been ongoing for a few years now. But with the BoJ launching a new form of policy easing on Wednesday, the yen could potentially depreciate significantly in the coming weeks and months.
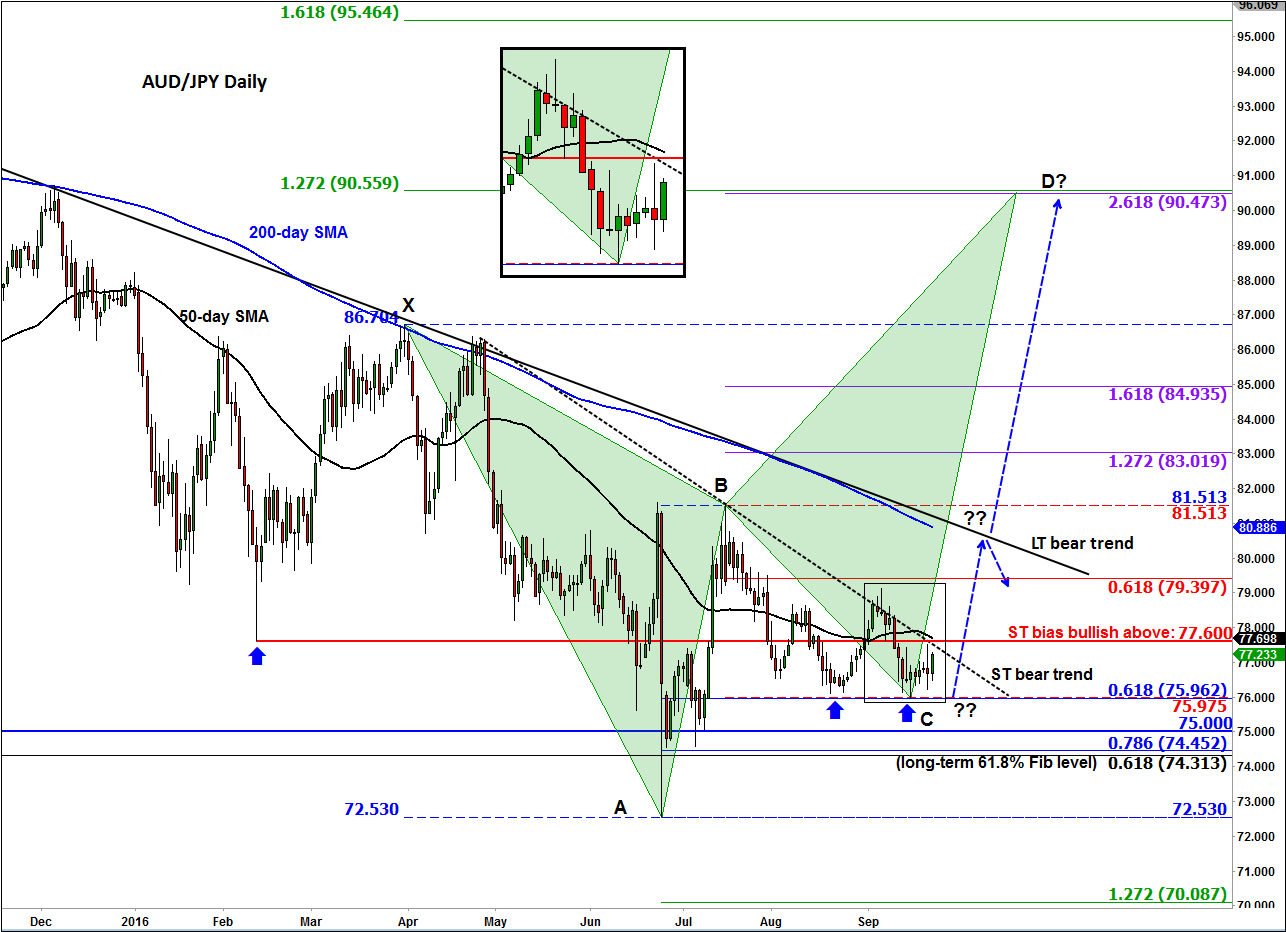
Technical outlook: AUD/JPY
Therefore, the AUD/JPY could start to push higher soon. In fact, that’s exactly what the chart, below, is pointing towards, even though the trend appears to be still pretty much bearish with the long-term moving averages pointing lower and a couple of bearish trend lines still being intact. But trends are there to be broken and while we don’t usually try to call market tops and bottoms, the AUD/JPY, may nevertheless be in the process of bottoming out. Let me explain.
Since making a low on the 26th June 2016 at the 72.50/55 area, the AUD/JPY has been stuck in an ugly consolidation. It has, however, managed to hold its own above the psychologically-important 75.00 handle and also the long-term 61.8% Fibonacci retracement of the 2008-2013 upswing at 74.30. Interestingly, the retracement to the 61.8% Fibonacci level has been observed on the short-term swings, too. For example, the rally from point A to point B was a 61.8% Fibonacci retracement of the XA swing, while the sell-off from point B to C was a 61.8% Fibonacci retracement of the AB swing. In other words, harmonic price behaviour is being observed in the AUD/JPY, which is why I have plotted on the chart a Butterfly, the two green triangles. If the market has indeed already bottomed out, then the pullback to the 61.8% at point C was the first higher low i.e. at just below 76.00.
For the AUD/JPY to make a higher high now, it would have to break through the previous high at around the 81.50 area. However, to even get to this level, the bulls would need to chop some wood. First up is short-term resistance at 77.60/70, which is where the first of the two bearish trend lines converge with the 50-day moving average. Above here and the short-term path of least resistance would be to the upside. Another potential short-term resistance level could be around 79.10/40 area, where the short term range high meets the 61.8% Fibonacci level of the BC swing. The key resistance however is at 80.50-90 area: here, the 200 day moving average converges with the long-term bearish trend line. But if the AUD/JPY were to break above this level then we may eventually see the onset of a rally towards the projected point D at 90.00/50 area – which is admittedly miles away from where we are at the moment.
All that being said, let’s not forget that the above is an ideal bullish scenario and at the moment, the sellers are still in control, judging, for example, by the direction of the trend lines and the moving averages. What this means from a trading point of view is that the buyers may wish to wait for price to confirm the bullish scenario, for example if 77.60 resistance breaks, while the bears may want to step back in only when this potentially bullish pattern becomes invalid, say by a decisive break below 75.00.
From time to time, StoneX Financial Pty Ltd (“we”, “our”) website may contain links to other sites and/or resources provided by third parties. These links and/or resources are provided for your information only and we have no control over the contents of those materials, and in no way endorse their content. Any analysis, opinion, commentary or research-based material on our website is for information and educational purposes only and is not, in any circumstances, intended to be an offer, recommendation or solicitation to buy or sell. You should always seek independent advice as to your suitability to speculate in any related markets and your ability to assume the associated risks, if you are at all unsure. No representation or warranty is made, express or implied, that the materials on our website are complete or accurate. We are not under any obligation to update any such material.
As such, we (and/or our associated companies) will not be responsible or liable for any loss or damage incurred by you or any third party arising out of, or in connection with, any use of the information on our website (other than with regards to any duty or liability that we are unable to limit or exclude by law or under the applicable regulatory system) and any such liability is hereby expressly disclaimed.
City Index is a trading name of StoneX Financial Pty Ltd.
The material provided herein is general in nature and does not take into account your objectives, financial situation or needs.
While every care has been taken in preparing this material, we do not provide any representation or warranty (express or implied) with respect to its completeness or accuracy. This is not an invitation or an offer to invest nor is it a recommendation to buy or sell investments.
StoneX recommends you to seek independent financial and legal advice before making any financial investment decision. Trading CFDs and FX on margin carries a higher level of risk, and may not be suitable for all investors. The possibility exists that you could lose more than your initial investment further CFD investors do not own or have any rights to the underlying assets.
It is important you consider our Financial Services Guide and Product Disclosure Statement (PDS) available at www.cityindex.com/en-au/terms-and-policies/, before deciding to acquire or hold our products. As a part of our market risk management, we may take the opposite side of your trade. Our Target Market Determination (TMD) is also available at www.cityindex.com/en-au/terms-and-policies/.
StoneX Financial Pty Ltd, Suite 28.01, 264 George Street, Sydney, NSW 2000 (ACN 141 774 727, AFSL 345646) is the CFD issuer and our products are traded off exchange.
© City Index 2024