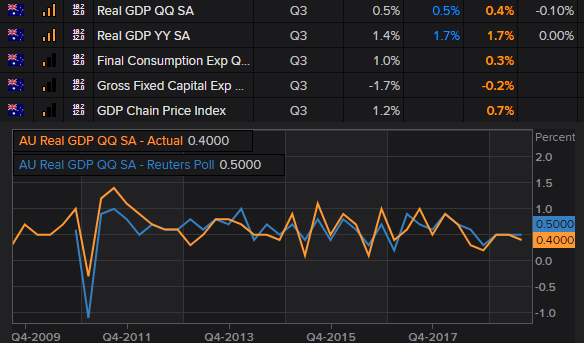
AU GDP Miss Undermines RBAs Gentle Turning Point
It didn’t take twitter long to react and compare the soft GDP read to RBA’s expectations. As we outlined yesterday, RBA gave themselves some very soft targets to hit and a long time to achieve them. Given they explicitly said publicly they’ll ease further if they’re not on track to hit these (soft) targets, it increases the odds for them to act sooner than the otherwise, cautiously optimistic statement suggested. Again, it underscores why we pay more attention to their speeches than their statements, as the latter tends to paint a rosier picture.
The next key data point for AUD traders this week is tomorrow’s retail sales whch is expected to rise to 0.3% from 0.2% prior, which leaves room for disappointment. Key data from the US data includes ISM non-manufacturing later today and of course NFP on Friday. Add into the mix Trump’s new relaxed approach to trade talks which is weighing on equities, then there’s a bearish case to be made for the Aussie over the near-term.
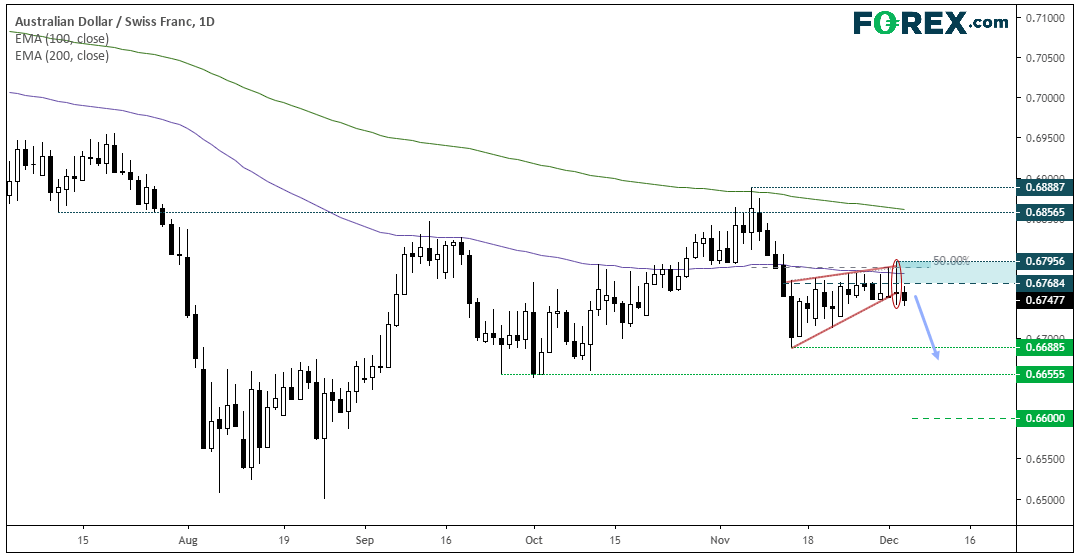
AUD/CHF is coiling up within a potential bearish wedge pattern. Since the 19th November, there have been 8 sessions with high wicks which failed to close above 0.6785, making it an important level of resistance to monitor. In context of yesterday’s bearish outside candle and that today’s high is also below 0.6785 resistance, the path of least resistance could point lower.
However, for this to have a higher probability of success, we’d likely need to see trade headline continue to weigh on risk sentiment and retail sales miss the mark tomorrow.
- Bias remains bearish below 0.6795, although 0.6785 is also a resistance level to monitor to either aid with risk management, or use as a threshold to fade into whilst prices remains beneath it
- Initial target is the base of the wedge at 0.6688. Although if we’re in fact seeing a bearish flag, it projects target around 0.6600.
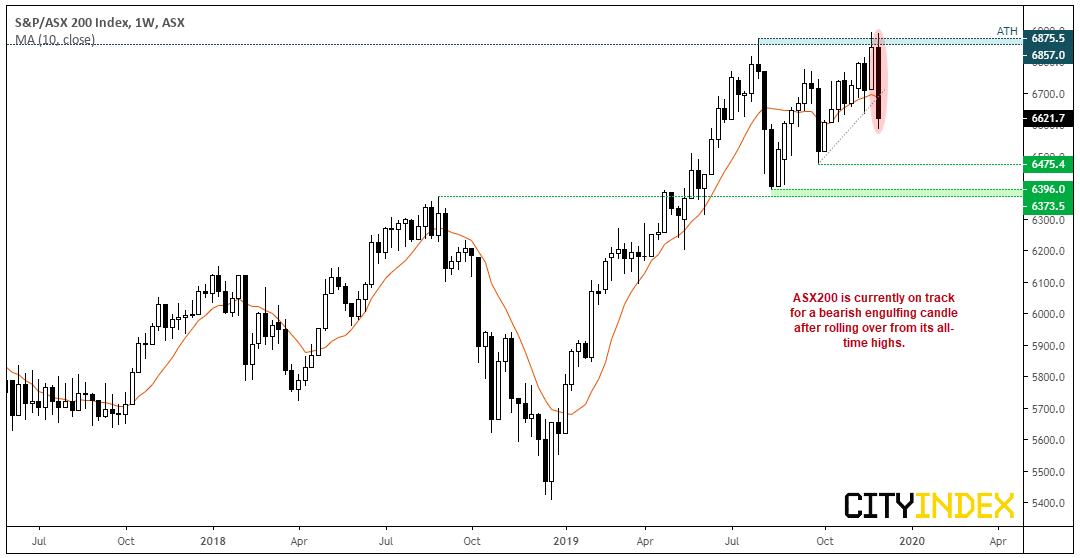
The ASX200 is on track for a bearish engulfing week (just two days into the week…). This would be the seconds bearish engulfing candle in three weeks if this turns out to be the case. We recently ran a test on a bearish outside week and concluded that they showed a higher chance of success if they close beneath the 10-week MA. When they didn’t, they showed positive returns the week after (ad indeed we saw the ASX200 rebound last week). Whilst we’re yet to repeat the test on a bearish engulfing candle, its worth noting that it is currently beneath its 10-week MA and on track for its most bearish week this year, after rolling over form all-time highs. So expect a follow up post on this pattern if it is confirmed.
Related Analysis:
RBA Hold Rates, Yet Could 'Ease' Their Way Into 2020
Historically, How Bearish Has A 'Bearish Outside Week' Been On The ASX200?
Weekly and Monthly Bearish Engulfing Candles Appear On DXY - But Just How Grizzly Are They?
From time to time, StoneX Financial Pty Ltd (“we”, “our”) website may contain links to other sites and/or resources provided by third parties. These links and/or resources are provided for your information only and we have no control over the contents of those materials, and in no way endorse their content. Any analysis, opinion, commentary or research-based material on our website is for information and educational purposes only and is not, in any circumstances, intended to be an offer, recommendation or solicitation to buy or sell. You should always seek independent advice as to your suitability to speculate in any related markets and your ability to assume the associated risks, if you are at all unsure. No representation or warranty is made, express or implied, that the materials on our website are complete or accurate. We are not under any obligation to update any such material.
As such, we (and/or our associated companies) will not be responsible or liable for any loss or damage incurred by you or any third party arising out of, or in connection with, any use of the information on our website (other than with regards to any duty or liability that we are unable to limit or exclude by law or under the applicable regulatory system) and any such liability is hereby expressly disclaimed.
City Index is a trading name of StoneX Financial Pty Ltd.
The material provided herein is general in nature and does not take into account your objectives, financial situation or needs.
While every care has been taken in preparing this material, we do not provide any representation or warranty (express or implied) with respect to its completeness or accuracy. This is not an invitation or an offer to invest nor is it a recommendation to buy or sell investments.
StoneX recommends you to seek independent financial and legal advice before making any financial investment decision. Trading CFDs and FX on margin carries a higher level of risk, and may not be suitable for all investors. The possibility exists that you could lose more than your initial investment further CFD investors do not own or have any rights to the underlying assets.
It is important you consider our Financial Services Guide and Product Disclosure Statement (PDS) available at www.cityindex.com/en-au/terms-and-policies/, before deciding to acquire or hold our products. As a part of our market risk management, we may take the opposite side of your trade. Our Target Market Determination (TMD) is also available at www.cityindex.com/en-au/terms-and-policies/.
StoneX Financial Pty Ltd, Suite 28.01, 264 George Street, Sydney, NSW 2000 (ACN 141 774 727, AFSL 345646) is the CFD issuer and our products are traded off exchange.
© City Index 2024