ASX Long And Short Of It BFT WES IVC
- It’s been a volatile week for equities globally, which were initially spooked on Tuesday another negative print from ISM manufacturing report. Whilst we’ve seen a minor rebound on Trump’s reassurance that “talks are going well” the markets aren’t really ‘buying it’, so we need further clarification from China.
- Technically, the week closed with another bearish outside week (its 2nd over 3 weeks) and twice failed to close above the prior all-time highs of 6875.50. So the market may well have topped in our view without a breakthrough in trade talks. Whilst we’d love to see a Santa’s rally, it took until the last week of December in 2018 for it to finally arrive. So let price action be your guide.
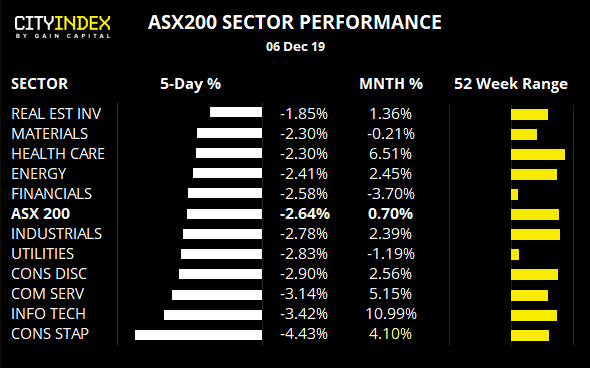
- We can see that all sectors closed in the red this week, with consumer staples and info tech bearing the brunt. The energy index will largely take it direction from the conclusion of this week’s OPEC meeting early next week, so keep that in mind of trading equities within the sector. Consumer discretionary, healthcare and info tech sectors remain technically strong, although all sectors are on the back foot and to the mercy of global sentiment.
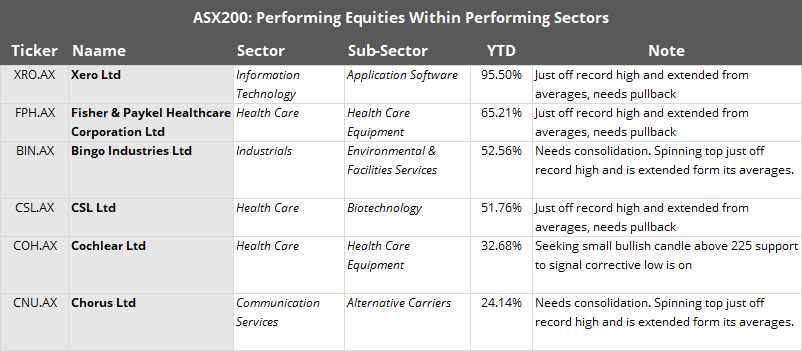
These equities display trade within strong sectors whilst also showing strong, bullish trends. Whilst they don’t quite qualify for an immediate entry, they’re on our radar should they do so in future.
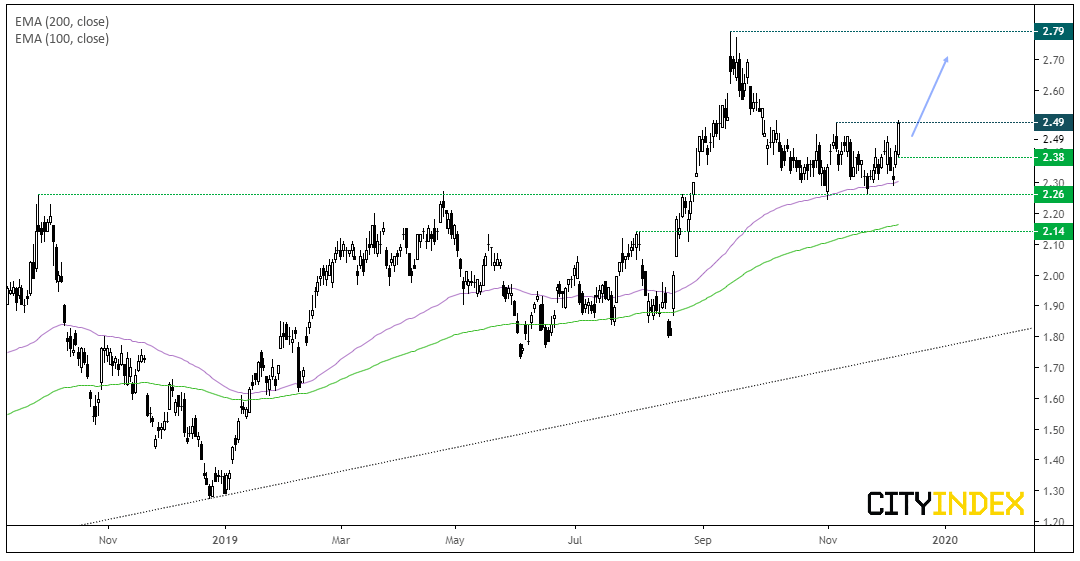
Beach Energy CFD/DFT: Despite poor returns from the energy sector this year, Beach Energy has packed a punch with an 85% return YTD. In the prior report, we had flagged it as one to monitor around the pivotal level of 2.26, as a bounce higher would have reaffirmed the support level in line with the dominant trend. Failing that, it left the potential for a 12c countertrend move. Well, it chosen the former scenario and the 100-day eMA continues to support and prices are considering a break higher.
- Bias remains bullish above 2.25, although today’s low at 2.38 can also be used to aid with risk management if momentum if bullish on Monday.
- Initial target is the 2.79 high.
- Keep in mind today’s OPEC meeting can have a direct impact on the energy sector on Monday’s open.
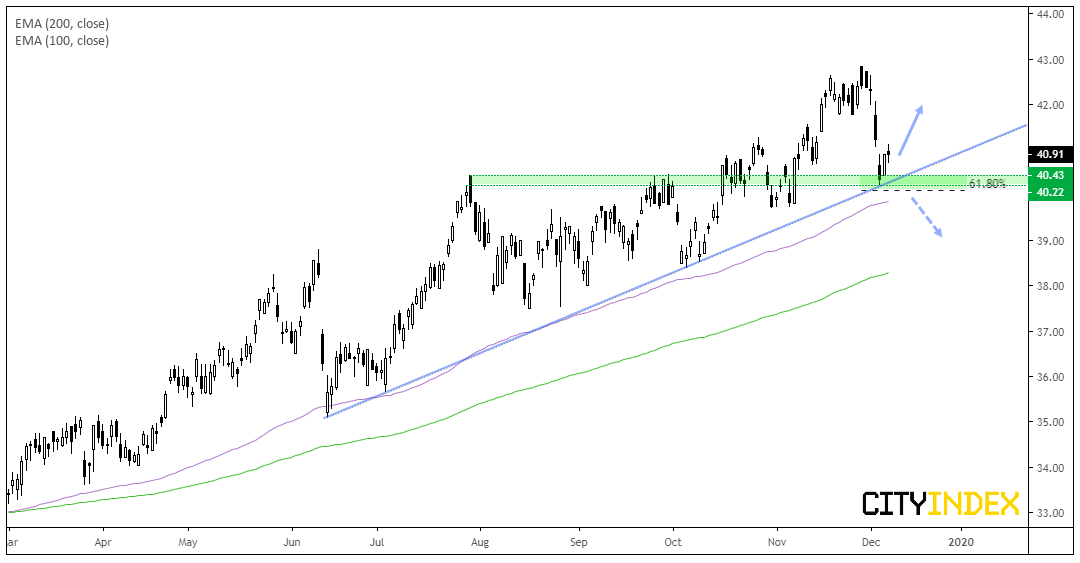
Wesfarmers CFD/DFT: This is one to monitor next week to see if bullish momentum returns. The direct losses from 43 are a concern yet encouraging to see support found around 40.22-40.43. Moreover, this zone coincides with the bullish trendline from the June low, making it a pivotal level to watch.
- Bulls can seek more evidence that a trough is being formed or consider entry if bullish momentum returns to suggest the swing low is in at 40.22.
- A break below 40.22 invalidates the bullish bias and could be one for counter-trend traders to consider if the bullish trendline breaks.
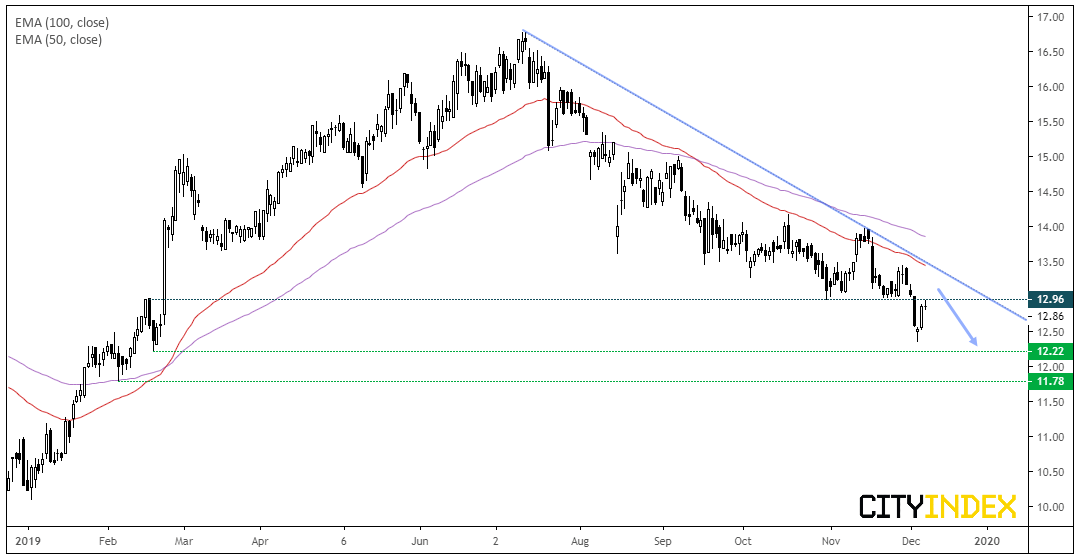
Invocare CFD/DFT: Prices remains below the bearish trendline and, having broken through support around 13 this week, has now pulled back into this key level. Perhaps we’ll now see it turned into resistance, although traders could consider bearish setups whilst it trades below the bearish trendline and / or the 13.50 high.
Price Action Update
Nanosonic CFD/DFT (NAN): There’s no denying it, this one failed having broken the wrong way out of compression (down) and straight through the bullish trendline. It remains in a strong sector so may return but, for now, has been removed from the watchlist.
Galaxy Resources CFD/DFT (GXY): The triple top target around 0.875 has been met and exceeded and prices are now headed for the lows around 0.815-0.830. The bearish channel remains intact, so the bias is for ran eventual break low which pave the way for 0.675. However, we urge cation around current levels as the September lows may beckon profit taking and therefore a rebound over the near-term.
Newcrest Mining CFD/DFT: 31.49 resistance held and, after some time oscillating sideways is now on route to the target around 28. Thursday’s bearish engulfing candle suggests bears remain I control, so the near-term bias remain bearish whilst 29.93 resistance holds.
REA Group Ltd CFD/DFT: The retracement on this was deeper than we’d have liked and traded above the 106 threshold we’d used to invalidate the idea, before finally falling lower. Price action is now messy so has been removed from the watchlist for now.
Bank of Queensland CFD: This was flagged on the 8th November for a likely breakdown and it has not disappointed. After a small consolidation, prices gapped low and bears drove it beneath the 8.02 target. With no signs of mean reversion, it’s vulnerable to snapping back to its mean, so is on the backburner for now.
Related analysis:
Historically, How Bearish Has A 'Bearish Outside Week' Been On The ASX200?
S&P500: The Long And Short Of It | AMD, United Technologies, Apache, NiScource
FTSE: The Long & Short Of It | EasyJet, Compass, Hiscox
ASX200: The Long And Short Of It | NAN, GXY, REA, BPT
From time to time, StoneX Financial Pty Ltd (“we”, “our”) website may contain links to other sites and/or resources provided by third parties. These links and/or resources are provided for your information only and we have no control over the contents of those materials, and in no way endorse their content. Any analysis, opinion, commentary or research-based material on our website is for information and educational purposes only and is not, in any circumstances, intended to be an offer, recommendation or solicitation to buy or sell. You should always seek independent advice as to your suitability to speculate in any related markets and your ability to assume the associated risks, if you are at all unsure. No representation or warranty is made, express or implied, that the materials on our website are complete or accurate. We are not under any obligation to update any such material.
As such, we (and/or our associated companies) will not be responsible or liable for any loss or damage incurred by you or any third party arising out of, or in connection with, any use of the information on our website (other than with regards to any duty or liability that we are unable to limit or exclude by law or under the applicable regulatory system) and any such liability is hereby expressly disclaimed.
City Index is a trading name of StoneX Financial Pty Ltd.
The material provided herein is general in nature and does not take into account your objectives, financial situation or needs.
While every care has been taken in preparing this material, we do not provide any representation or warranty (express or implied) with respect to its completeness or accuracy. This is not an invitation or an offer to invest nor is it a recommendation to buy or sell investments.
StoneX recommends you to seek independent financial and legal advice before making any financial investment decision. Trading CFDs and FX on margin carries a higher level of risk, and may not be suitable for all investors. The possibility exists that you could lose more than your initial investment further CFD investors do not own or have any rights to the underlying assets.
It is important you consider our Financial Services Guide and Product Disclosure Statement (PDS) available at www.cityindex.com/en-au/terms-and-policies/, before deciding to acquire or hold our products. As a part of our market risk management, we may take the opposite side of your trade. Our Target Market Determination (TMD) is also available at www.cityindex.com/en-au/terms-and-policies/.
StoneX Financial Pty Ltd, Suite 28.01, 264 George Street, Sydney, NSW 2000 (ACN 141 774 727, AFSL 345646) is the CFD issuer and our products are traded off exchange.
© City Index 2024