Apple exposed to Huawei blowback
What if China targets Apple?
The stock rose along with resilient U.S. markets earlier, though with a 0.3% gain at best, it was unmistakeably lagging. The $878bn iPhone maker later slipped into the red, together with fellow large-caps, chiefly $204bn Intel, and others. It would be remiss to focus on one specific cause. However, among mega-caps, Apple is the top revenue generator in China, making 20% of total sales there in 2018. Its unique combination of elevated international, consumer, financial, and perhaps, political profiles suggests renewed investor caution. If China decides to retaliate at the corporate level for the U.S.’s proposed ban on Huawei, Apple would be a key candidate.
Earlier this month, the group said sales in China were stabilizing. But if Beijing restricts its ability to manufacture and sell there, a renewed crisis for Apple, Big Tech and markets overall would be likely. Between October and December, Apple shares led markets lower, plunging almost 40% when trade and economic anxieties where acute.
Washington is taking pains to separate the proposed Huawei ban from trade talks, though in practice that is impossible. Commerce Secretary Wilbur Ross hinted on Thursday that negotiations are partly aimed at remediating the type of actions Huawei faces punishment for. All the more reason why China’s response, if or when it comes, could be severe.
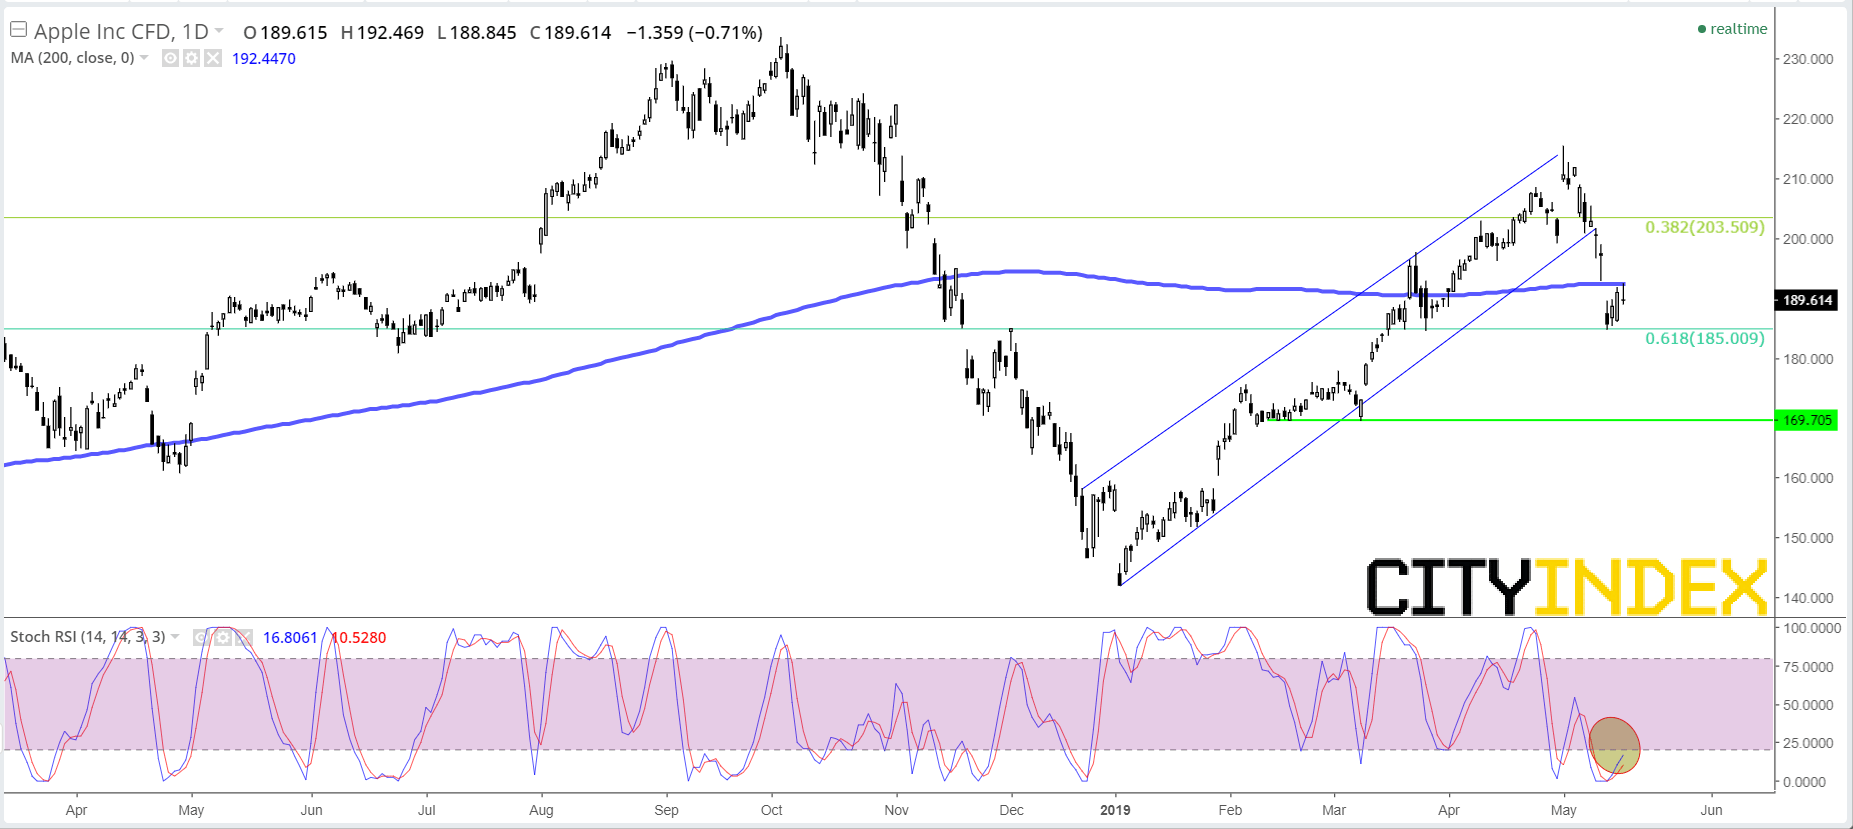
Chart thoughts
Apple’s chart is marked by a similar retreat of sentiment as the broader market. It has also found solace from recent selling after a pristine price reaction at a 61.8% Fibonacci broke its decline from the year’s highs. But a broken rising channel is still the dominant pattern in view. The stock is also now locked in battle with its 200-day trend, where price gapped last Friday confirming its pivotal significance. The reviving stochastic gauge must now follow through with gains that take price back above its 200-day average soon. If not, sellers will aim for the next likeliest floor: $169.70, the sight of tight consolidation over five straight sessions in February and a confirmatory one in March.
Price chart: Apple Inc. CFD – daily
Source: City Index
From time to time, StoneX Financial Pty Ltd (“we”, “our”) website may contain links to other sites and/or resources provided by third parties. These links and/or resources are provided for your information only and we have no control over the contents of those materials, and in no way endorse their content. Any analysis, opinion, commentary or research-based material on our website is for information and educational purposes only and is not, in any circumstances, intended to be an offer, recommendation or solicitation to buy or sell. You should always seek independent advice as to your suitability to speculate in any related markets and your ability to assume the associated risks, if you are at all unsure. No representation or warranty is made, express or implied, that the materials on our website are complete or accurate. We are not under any obligation to update any such material.
As such, we (and/or our associated companies) will not be responsible or liable for any loss or damage incurred by you or any third party arising out of, or in connection with, any use of the information on our website (other than with regards to any duty or liability that we are unable to limit or exclude by law or under the applicable regulatory system) and any such liability is hereby expressly disclaimed.
City Index is a trading name of StoneX Financial Pty Ltd.
The material provided herein is general in nature and does not take into account your objectives, financial situation or needs.
While every care has been taken in preparing this material, we do not provide any representation or warranty (express or implied) with respect to its completeness or accuracy. This is not an invitation or an offer to invest nor is it a recommendation to buy or sell investments.
StoneX recommends you to seek independent financial and legal advice before making any financial investment decision. Trading CFDs and FX on margin carries a higher level of risk, and may not be suitable for all investors. The possibility exists that you could lose more than your initial investment further CFD investors do not own or have any rights to the underlying assets.
It is important you consider our Financial Services Guide and Product Disclosure Statement (PDS) available at www.cityindex.com/en-au/terms-and-policies/, before deciding to acquire or hold our products. As a part of our market risk management, we may take the opposite side of your trade. Our Target Market Determination (TMD) is also available at www.cityindex.com/en-au/terms-and-policies/.
StoneX Financial Pty Ltd, Suite 28.01, 264 George Street, Sydney, NSW 2000 (ACN 141 774 727, AFSL 345646) is the CFD issuer and our products are traded off exchange.
© City Index 2024