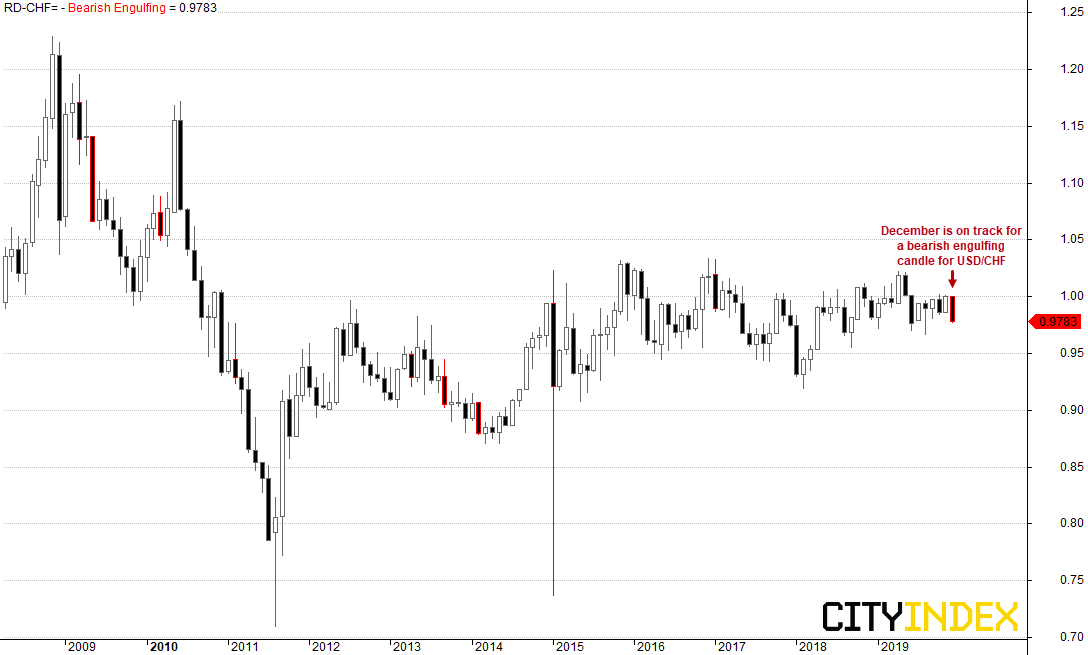
USDCHF Is On Track For A Bearish Engulfing Month
With USD/CHF on the cusp of a bearish engulfing month, we take a look at the pattern’s forward returns alongside the Swiss franc’s seasonality.
Unless USD/CHF can close above 0.9864 by the end of the year, its on track to close December with a bearish engulfing candle. It’s by no means a not a common event, having only occurred 19 times since 1982 and its last instance was in January 2017. But it does appear to be a bearish one overall looking at the forward returns.
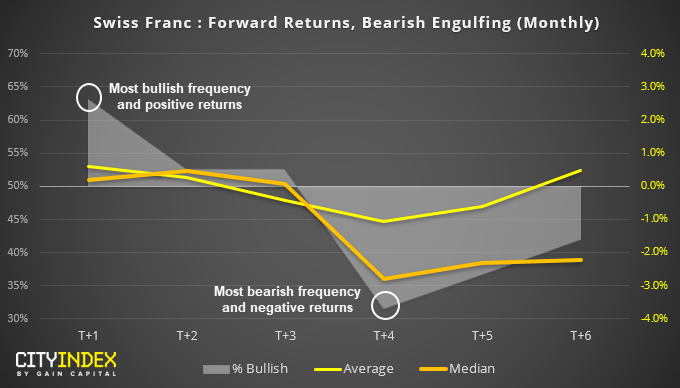
Monthly Reuters data since 1982
- Yet again we see a pattern which reverses at T+1. This suggests that the probability of January being bullish is 63.1% if December closes with a bearish engulfing month. Also notice that both median and average returns are positive to show its not being supported by outliers.
- The stats become a little murky at T+3 (February) as median returns are +0.2% whilst average returns are -6.8%. T+2 also closed higher 52.6% of the time, meaning less frequent yet more bearish returns weighed on the average. Ultimately, T+3 doesn’t fill us with confidence of a reliable read.
- T+4 (April) provides the most compellingly bearish result, as it is bearish 68.4% of the time with average and median returns at -2.8% and -15.5% respectively. Given median returns are more ‘typical’, then it adds greater weight to the bearishness of the engulfing candle +4 months out.
Seasonality points towards a rainy April:
Has luck would have it, April tends to be a bearish month according to seasonality. Moreover, April has provided negative average returns for USD/CHF over 50% over the past 5, 10, 15 and 30 years of data.
We can also see that December has followed its seasonal tendency for negative returns this month (albeit a miraculous turnaround before the end of the year).
Takeaways:
- USD/CHF has followed its seasonal tendency in December and likely to close lower
- Monthly bearish engulfing candles have provided their most bearish returns +4 months after the pattern occurred
- Whilst the pattern flags April has a potentially bearish month, seasonality has also favoured the bears in April.
Related Analysis:
USD/CHF Hesitates Below Parity (A Level Undefeated Since May)
Scope for Further Downside on USD/CHF
Historically, How Bearish Has A 'Bearish Outside Week' Been On The ASX200?
StoneX Financial Ltd (trading as “City Index”) is an execution-only service provider. This material, whether or not it states any opinions, is for general information purposes only and it does not take into account your personal circumstances or objectives. This material has been prepared using the thoughts and opinions of the author and these may change. However, City Index does not plan to provide further updates to any material once published and it is not under any obligation to keep this material up to date. This material is short term in nature and may only relate to facts and circumstances existing at a specific time or day. Nothing in this material is (or should be considered to be) financial, investment, legal, tax or other advice and no reliance should be placed on it.
No opinion given in this material constitutes a recommendation by City Index or the author that any particular investment, security, transaction or investment strategy is suitable for any specific person. The material has not been prepared in accordance with legal requirements designed to promote the independence of investment research. Although City Index is not specifically prevented from dealing before providing this material, City Index does not seek to take advantage of the material prior to its dissemination. This material is not intended for distribution to, or use by, any person in any country or jurisdiction where such distribution or use would be contrary to local law or regulation.
For further details see our full non-independent research disclaimer and quarterly summary.
CFDs are complex instruments and come with a high risk of losing money rapidly due to leverage. 69% of retail investor accounts lose money when trading CFDs with this provider. You should consider whether you understand how CFDs work and whether you can afford to take the high risk of losing your money. CFD and Forex Trading are leveraged products and your capital is at risk. They may not be suitable for everyone. Please ensure you fully understand the risks involved by reading our full risk warning.
City Index is a trading name of StoneX Financial Ltd. Head and Registered Office: 1st Floor, Moor House, 120 London Wall, London, EC2Y 5ET. StoneX Financial Ltd is a company registered in England and Wales, number: 05616586. Authorised and regulated by the Financial Conduct Authority. FCA Register Number: 446717.
City Index is a trademark of StoneX Financial Ltd.
The information on this website is not targeted at the general public of any particular country. It is not intended for distribution to residents in any country where such distribution or use would contravene any local law or regulatory requirement.
© City Index 2024