Weekly Technical Outlook on Major Stock Indices 27 May to 31 May 2019
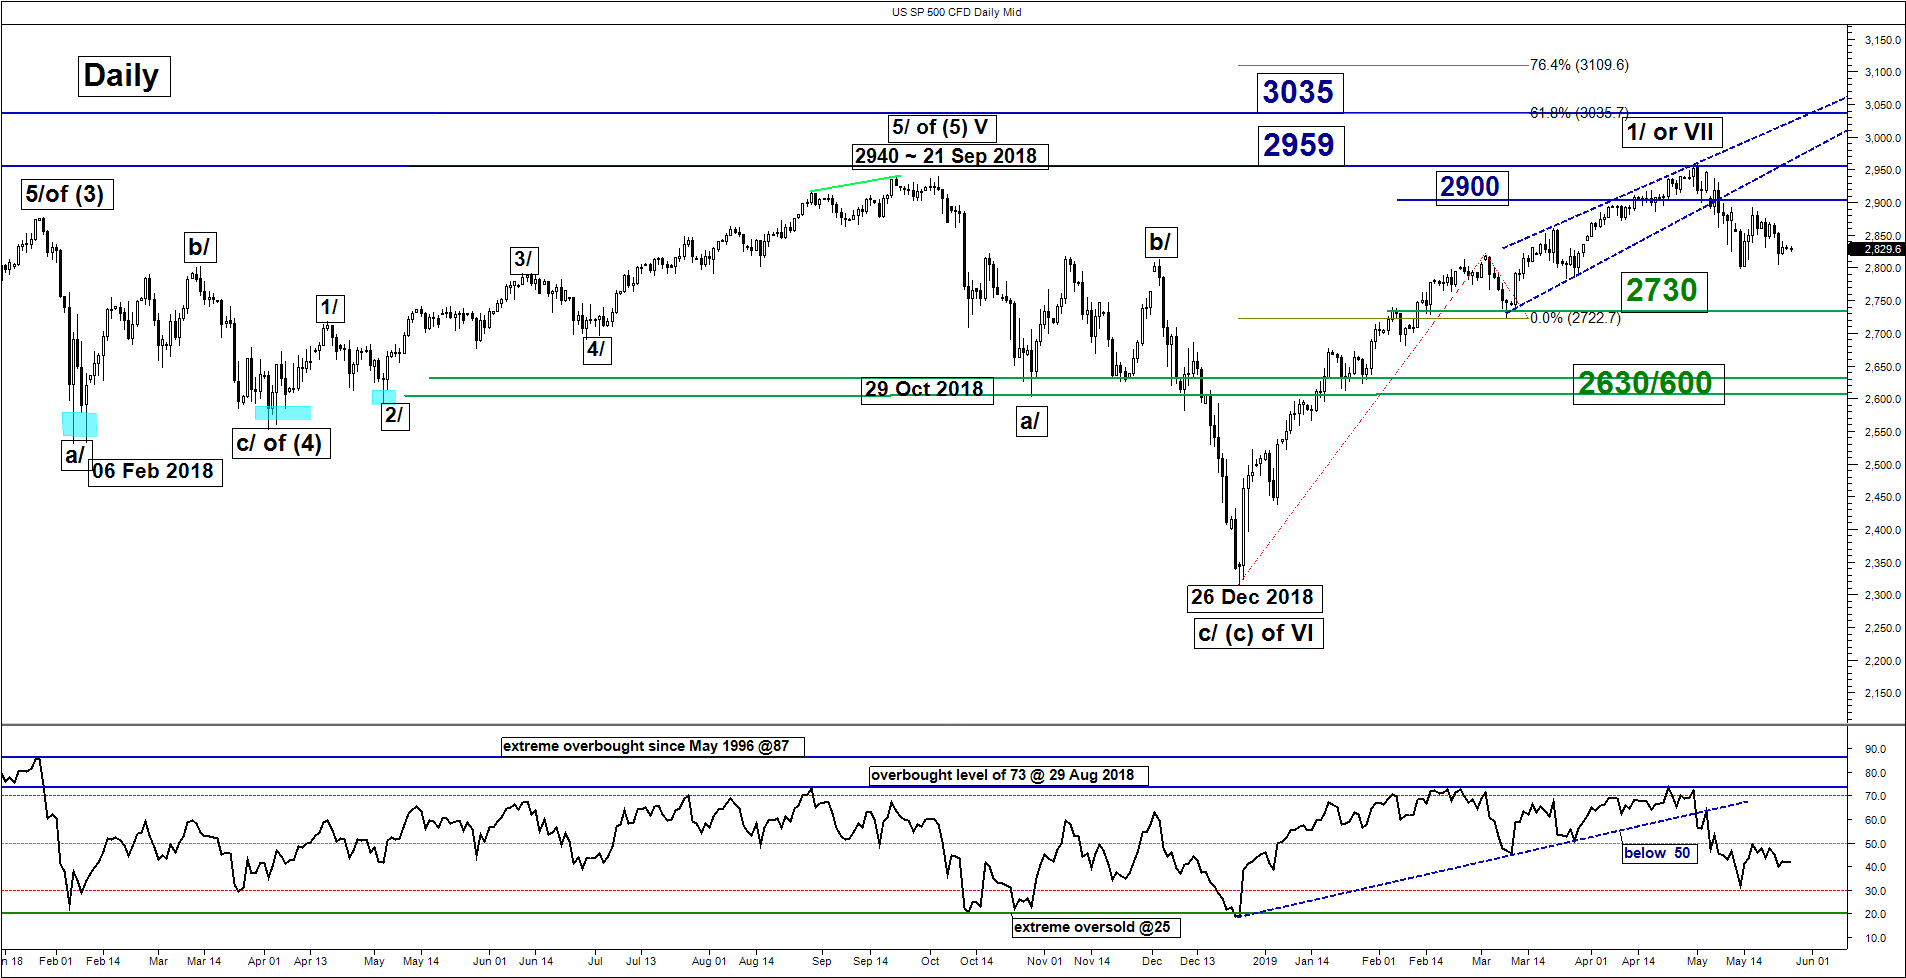
S&P 500 – Further potential corrective down move
click to enlarge charts
Key Levels (1 to 3 weeks)
Intermediate resistance: 2857
Pivot (key resistance): 2900
Supports: 2790 & 2730
Next resistance: 2959 & 3007
Medium-term (1 to 3 weeks) Outlook
In our previous weekly technical outlook report, we had highlighted the risk of an impending medium-term/multi-week corrective down move sequence for the SP 500 Index (proxy for the S&P 500 futures) below the 2920 key medium-term pivotal resistance (click here & here to recap).
Indeed, the Index had shaped the first leg of the corrective down move sequence and almost reached the first target/support of 2790 (printed a low of 2798 on 13 May 2019) before it shaped the expected consolidation phase below 2900 as per highlighted in our previous report.
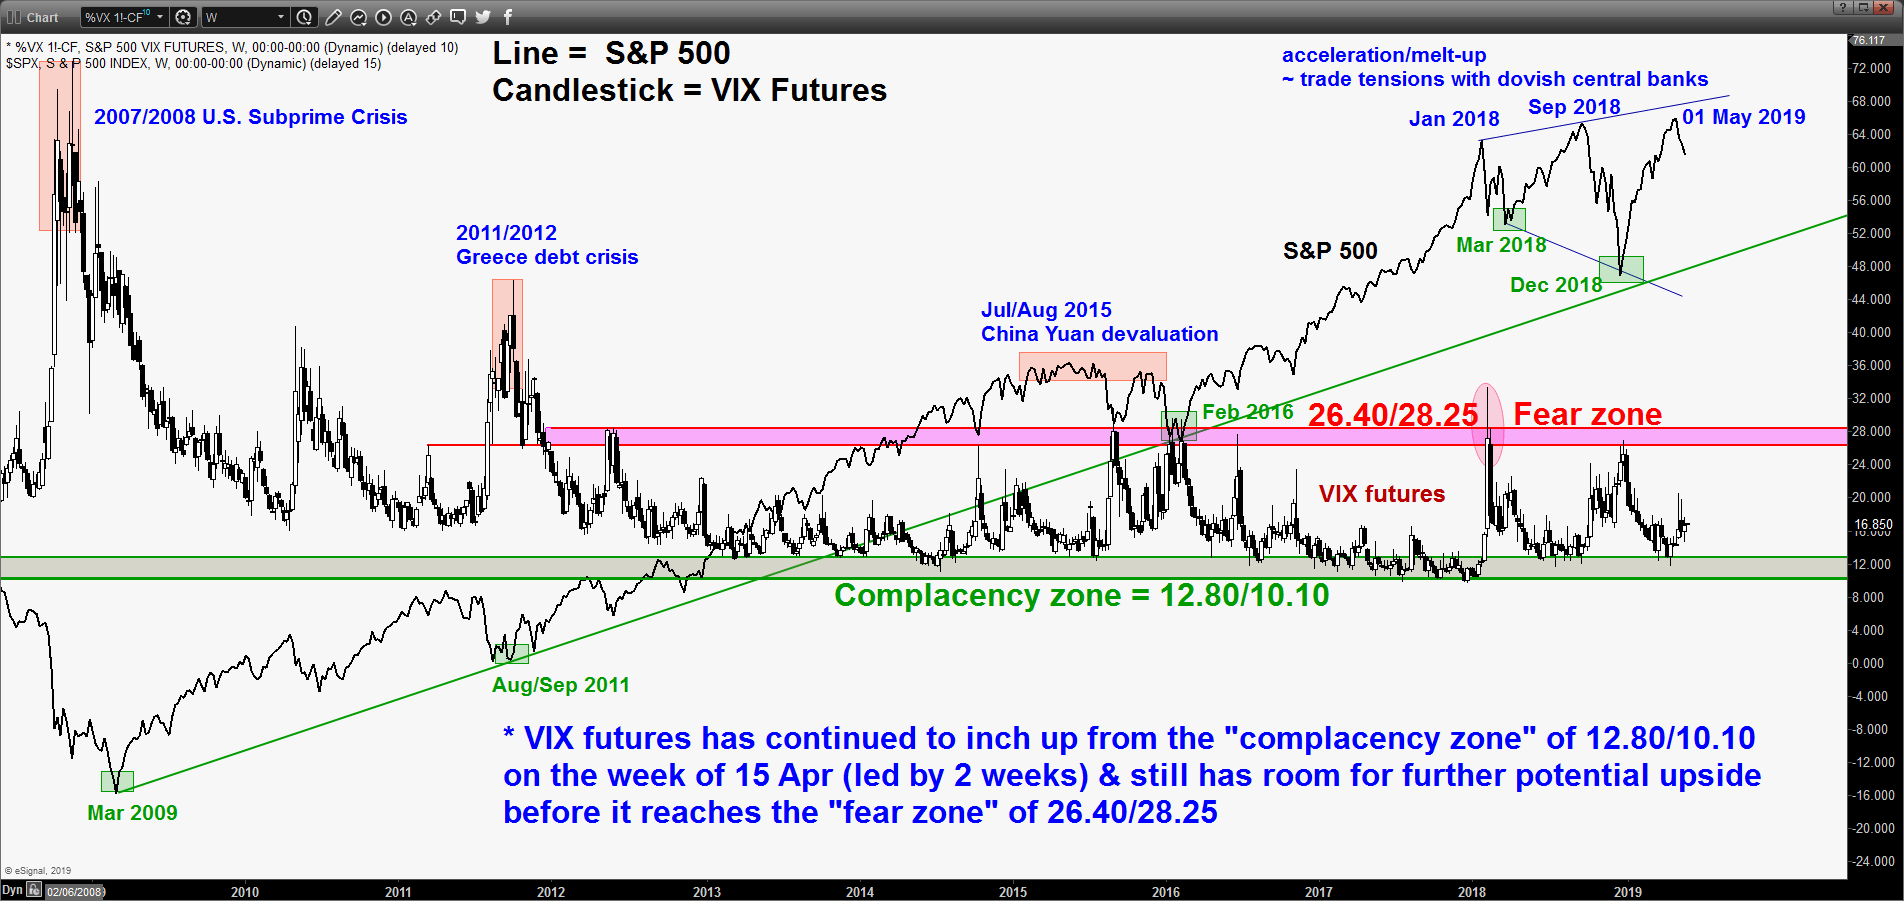
Current technical elements are still negative where the daily RSI oscillator remains below the 50 level and the VIX futures has continued to inch higher above the “complacency zone of 12.80/10.10. Maintain bearish bias with a tightened key medium-term pivotal resistance now at 2900 (close to 16 May swing high & the 61.8% retracement of the previous decline from 01 May high to 13 May 2019 low) for another potential downleg to target 2790 and 2730 next.
However, a clearance with a daily close above 2900 invalidates the bearish scenario for a continuation of the 5-month uptrend to retest its current all-time high at 2959 and even 3007 next (Fibonacci expansion).
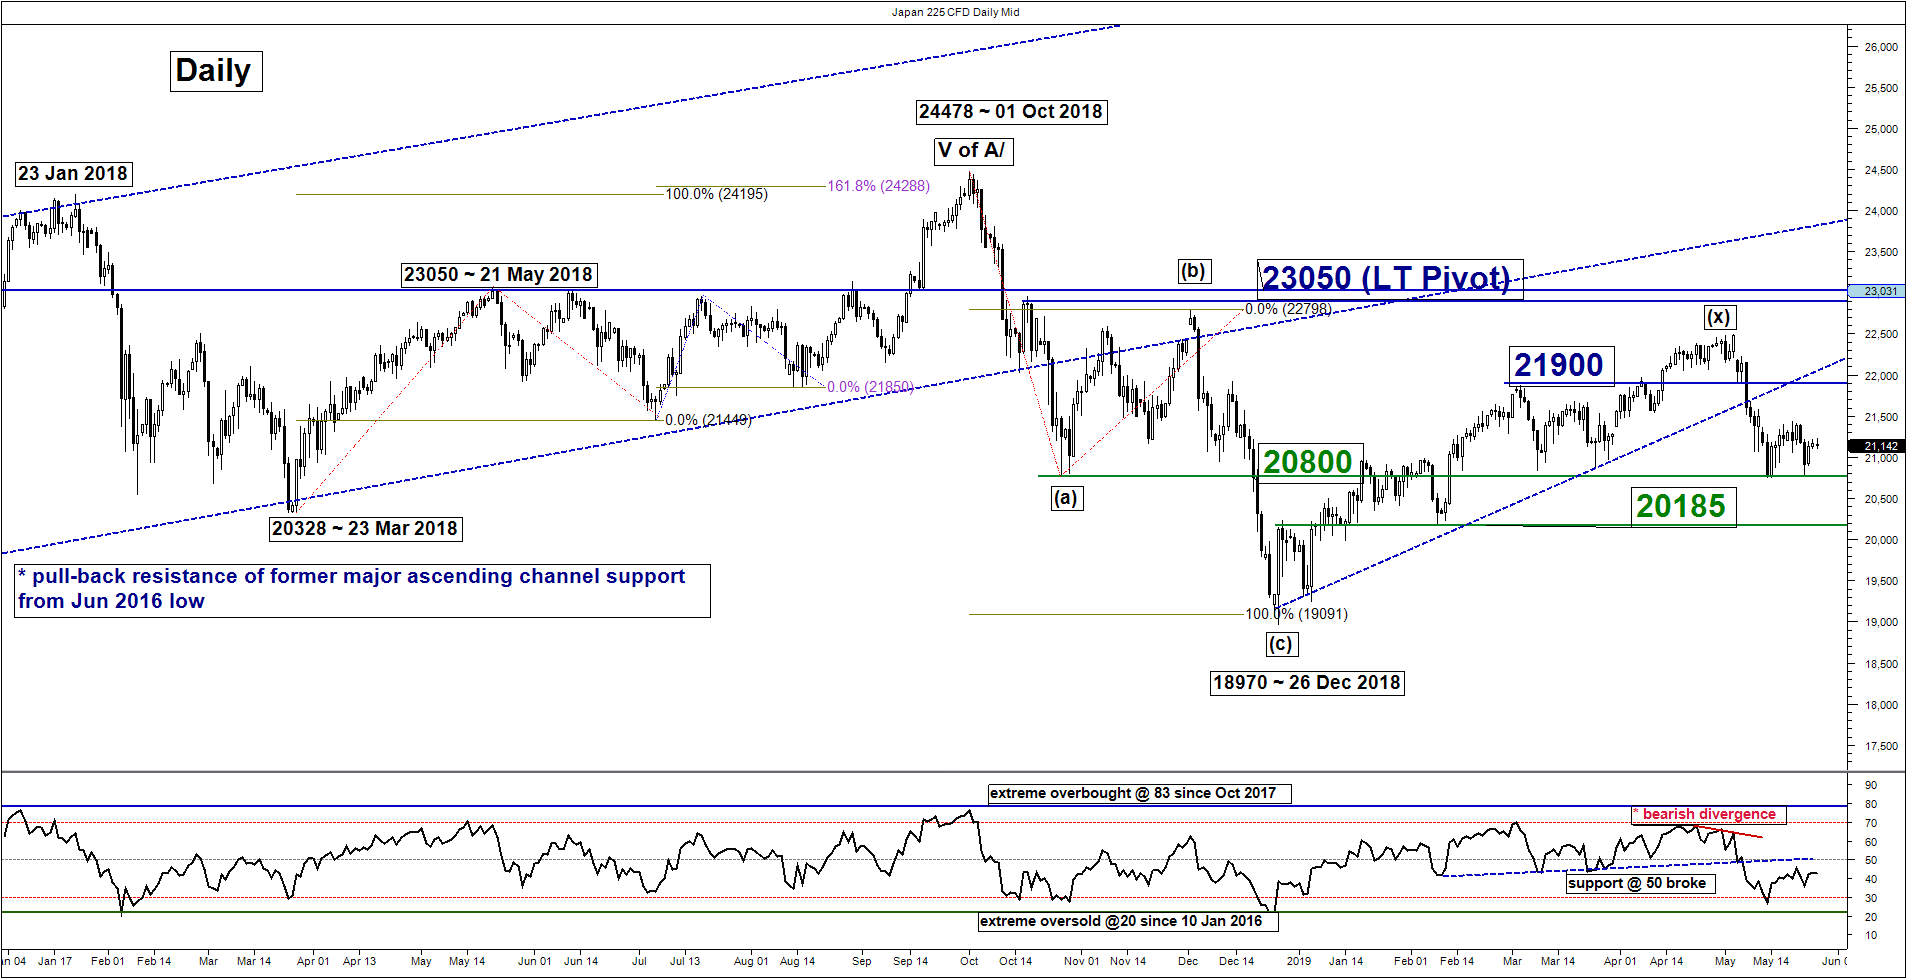
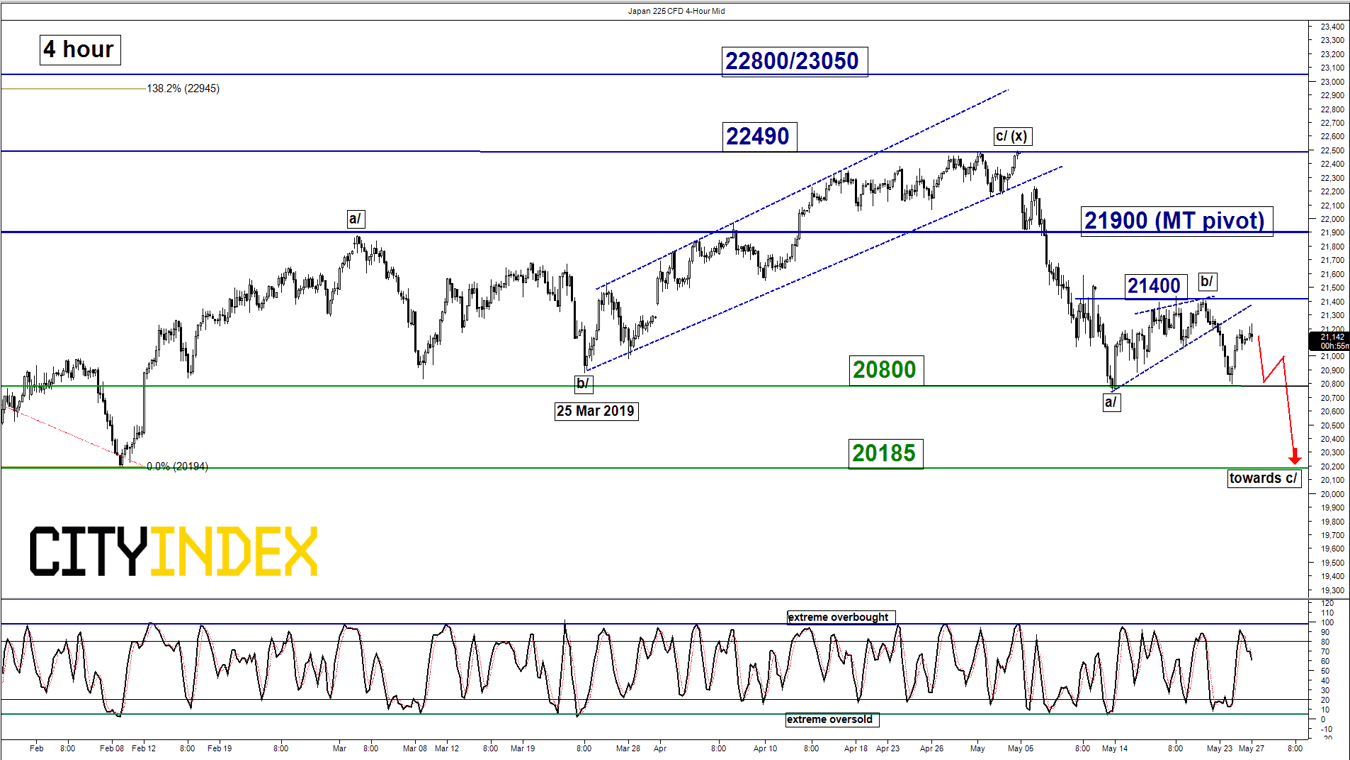
Nikkei 225 – 21900 remains the key resistance to watch
click to enlarge charts
Key Levels (1 to 3 weeks)
Intermediate resistance: 21400
Pivot (key resistance): 21900
Supports: 20800 & 20185
Next resistances: 22490 & 22800/23050
Medium-term (1 to 3 weeks) Outlook
The Japan 225 Index (proxy for the Nikkei 225 futures) had staged the expected push down to hit the first target/support of 21900 (printed a low of 20759 on 13 May 2019) before it traded sideways below 21400 in the past 9 days.
Technical elements remain negative; maintain bearish bias below the 21900 key medium-term pivotal resistance for a potential second downleg of the corrective down move sequence in place since 03 May 2019 to retest 20800 before targeting the next support at 20185.
However, a clearance with a daily close above 21900 invalidates the bearish scenario for a squeeze up towards 22490 and 22800/23050.
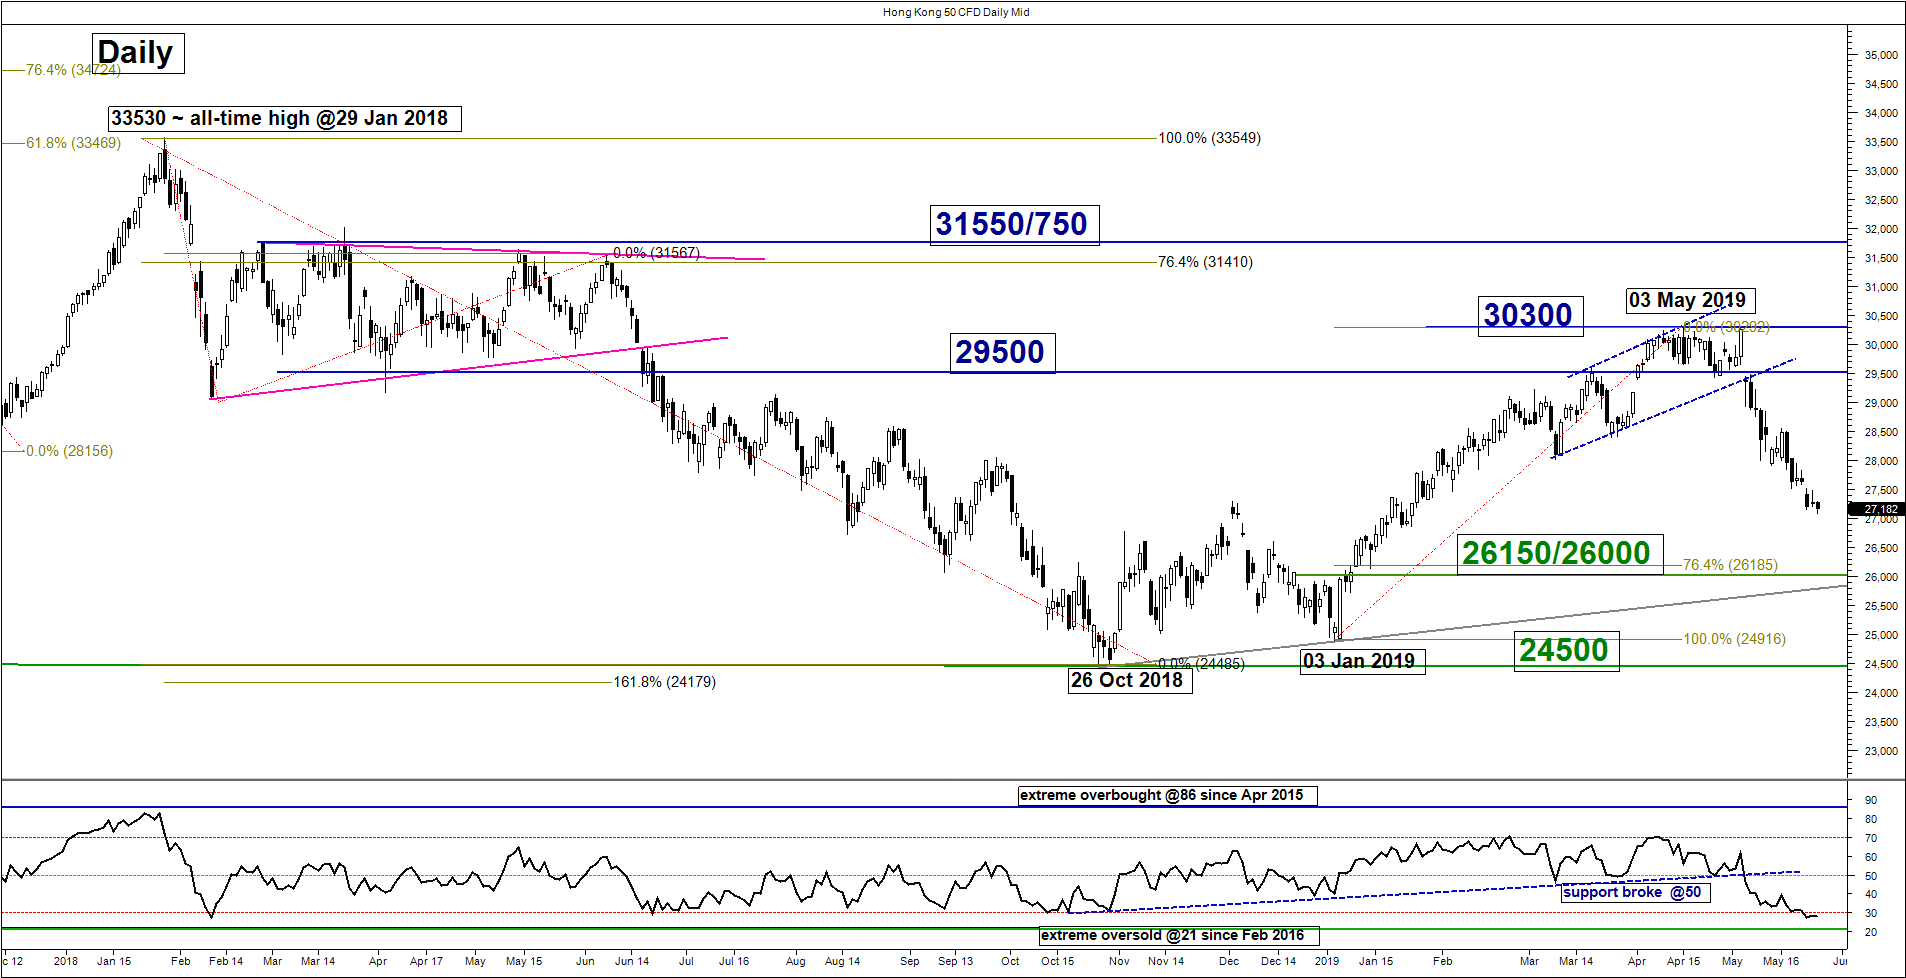
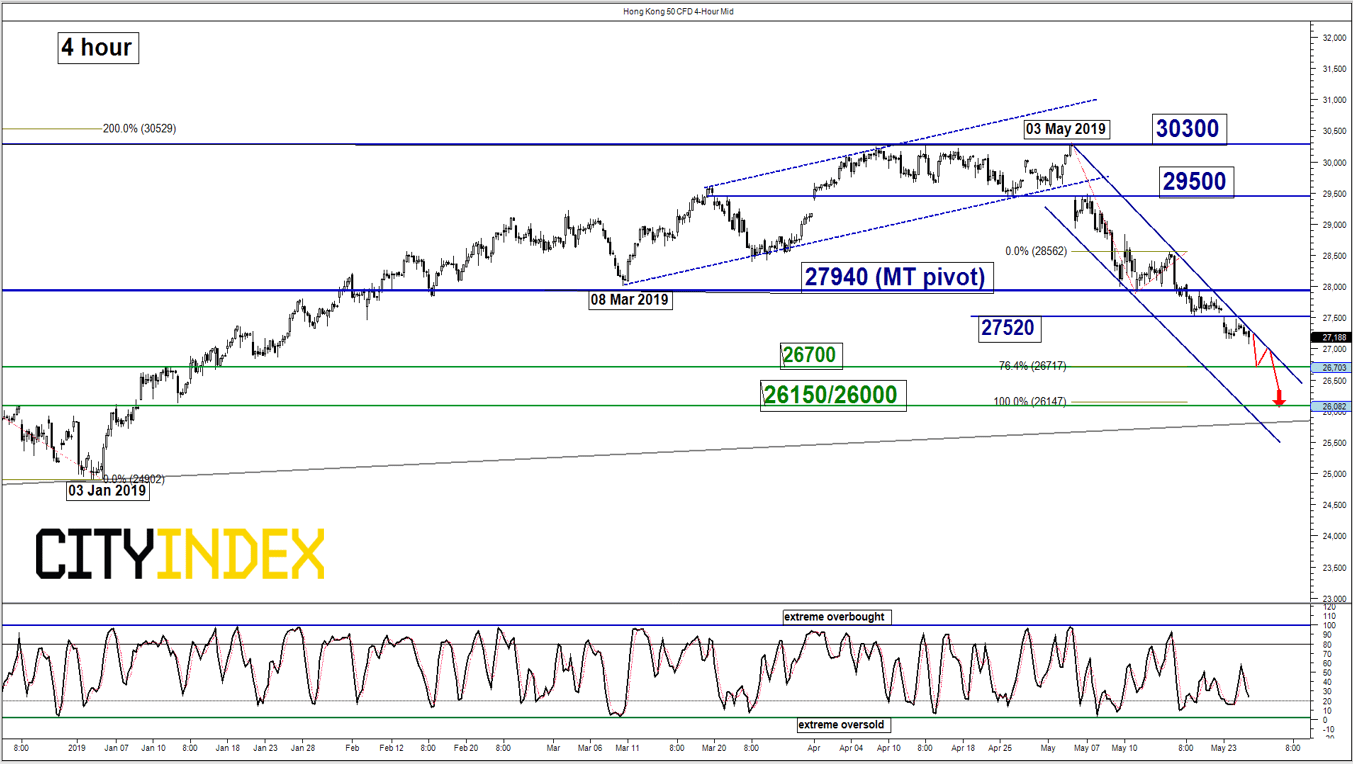
Hang Seng – Further downside pressure below 27940 key resistance
click to enlarge charts
Key Levels (1 to 3 weeks)
Intermediate resistance: 27520
Pivot (key resistance): 27940
Supports: 26700 & 26150/26000
Next resistances: 29500 & 30300
Medium-term (1 to 3 weeks) Outlook
The Hong Kong 50 Index (proxy for Hang Seng Index futures) had tumbled and hit the first target/support of 27290 as expected. Since its 03 May 2019 high of 30300, the Index has evolved within a descending channel with its upper boundary acting as a resistance at 27520. Medium-term momentum as indicated by the daily RSI oscillator is hovering at the oversold region but without any bullish divergence signal yet.
Maintain bearish bias with a tightened key medium-term pivotal resistance now at 27940 for another potential downleg to target 26700 and the key medium-term support at 26150/26000 (Fibonacci retracement/expansion cluster & the ascending support from 26 Oct 2018 low) before a potential recovery materialises.
However, a clearance with a daily close above 27940 negates the bearish tone for a retest on 29500.
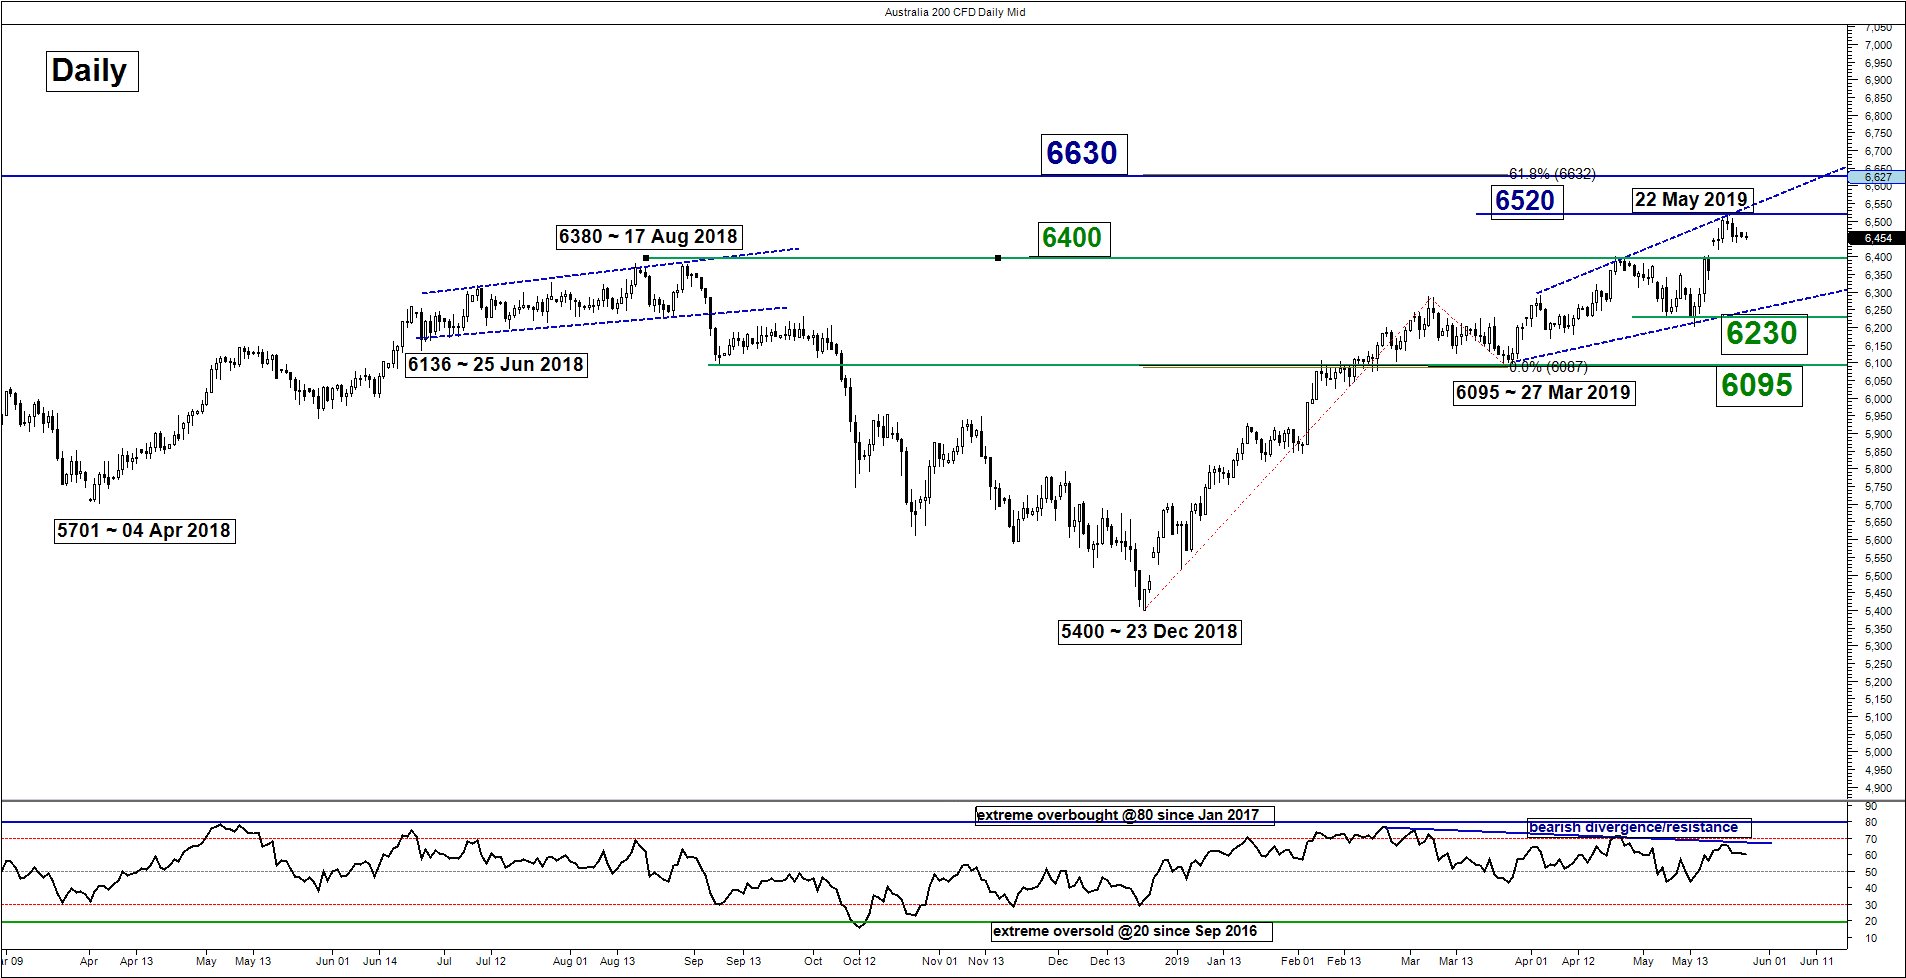
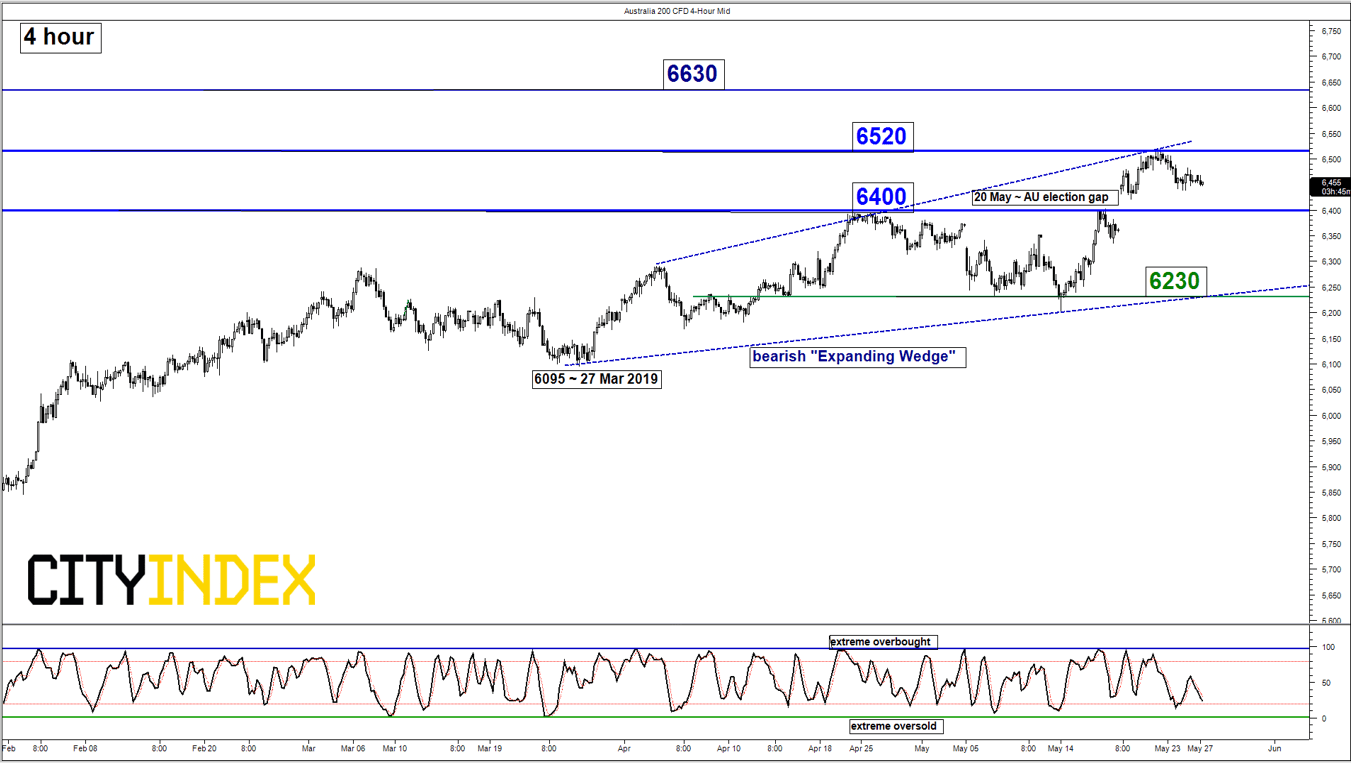
ASX 200 – Bullish exhaustion elements below 6520
click to enlarge charts
Key Levels (1 to 3 weeks)
Resistances: 6520 & 6630
Supports: 6400 & 6230
Medium-term (1 to 3 weeks) Outlook
The Australia 200 Index (proxy for the ASX 200 futures) had gapped up above the 6400 key medium-term resistance after the announcement of the AU election results on 20 May 2019 coupled with a dovish monetary policy stance adopted by the central bank, RBA that had guided market expectations of an interest rate cut in the next RBA meeting on 04 Jun 2019 from a record low of 1.50% since Aug 2016.
Current price action of the Index has started to evolve into a bearish “Expanding Wedge” configuration in place since 27 Mar 2019 with bearish negative momentum observations seen in the daily RSI oscillator. Interestingly, such pattern has been detected in the past price action of the Index from 25 Jun 2018 to 17 Aug 2018 (also a 2-month duration) before a significant correction of 15% took place to print a low 5400 on 23 Dec 2018.
Mix elements; prefer to turn neutral between 6520 and 6400. A break with below 6400 sees a further decline to test the lower boundary of the “Expanding Wedge” at 6230. On the flipside, a clearance above 6520 triggers a further rally towards the next resistance at 6630.
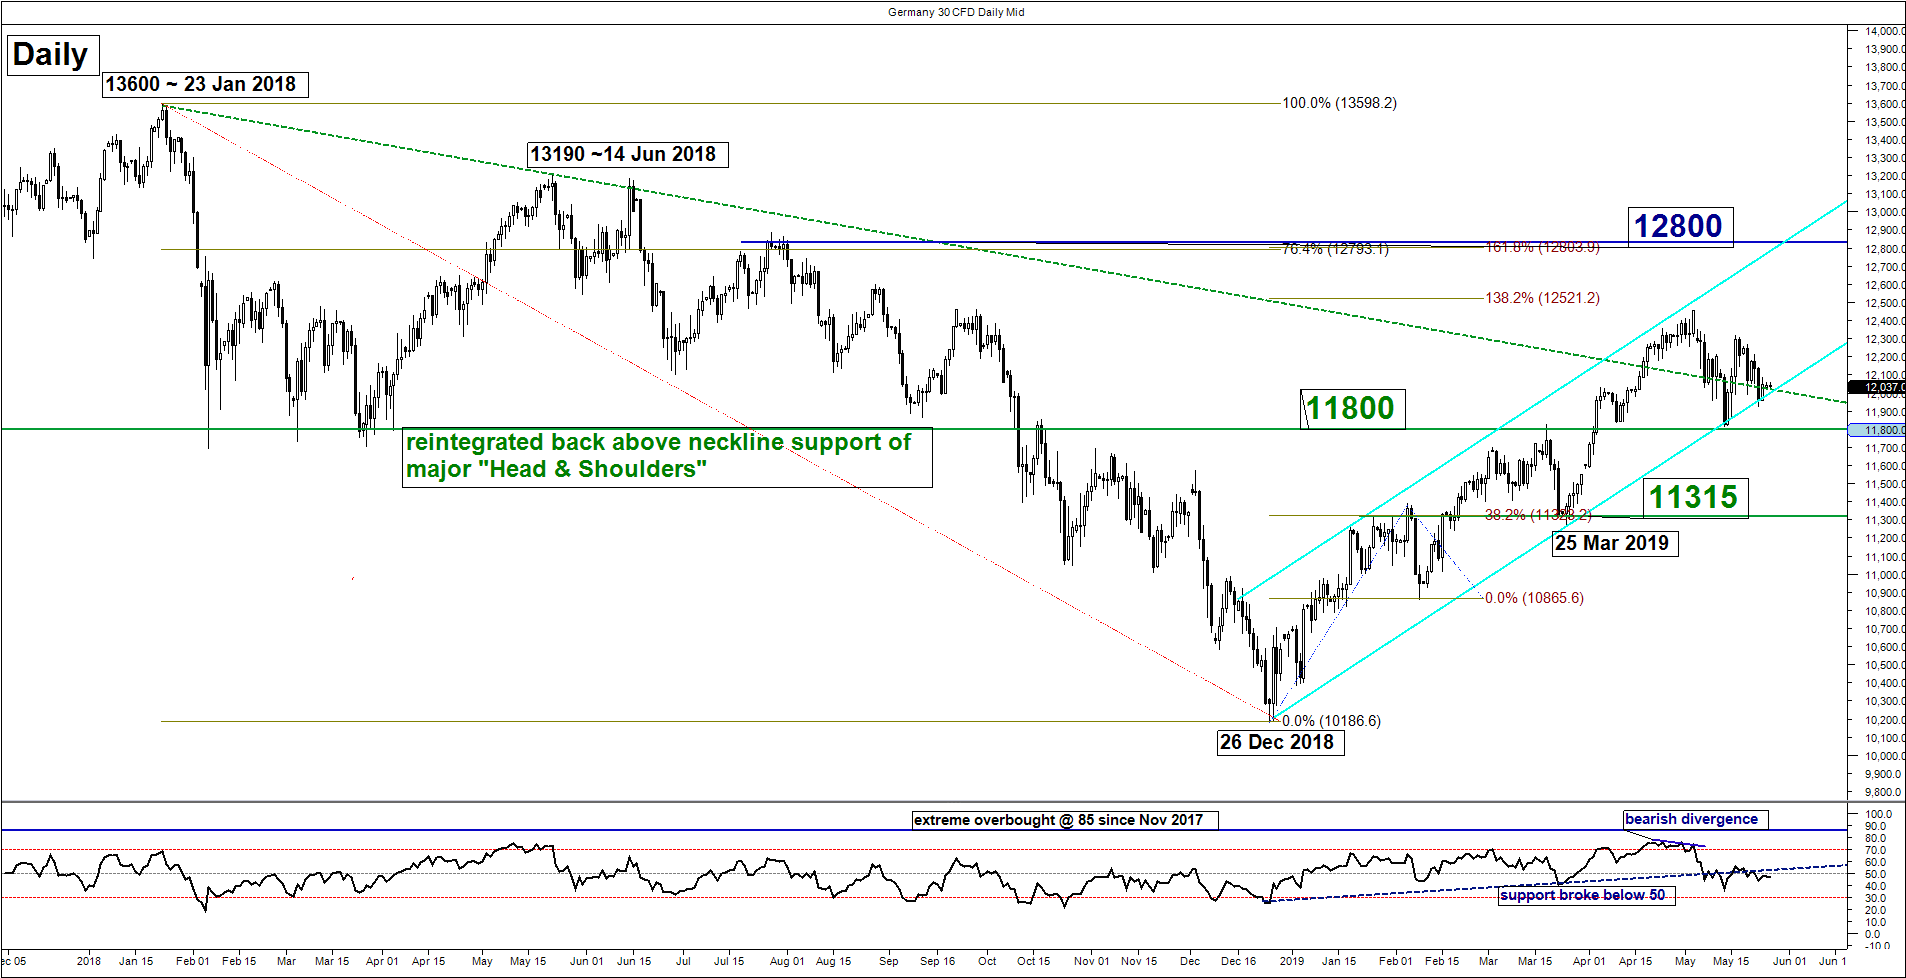
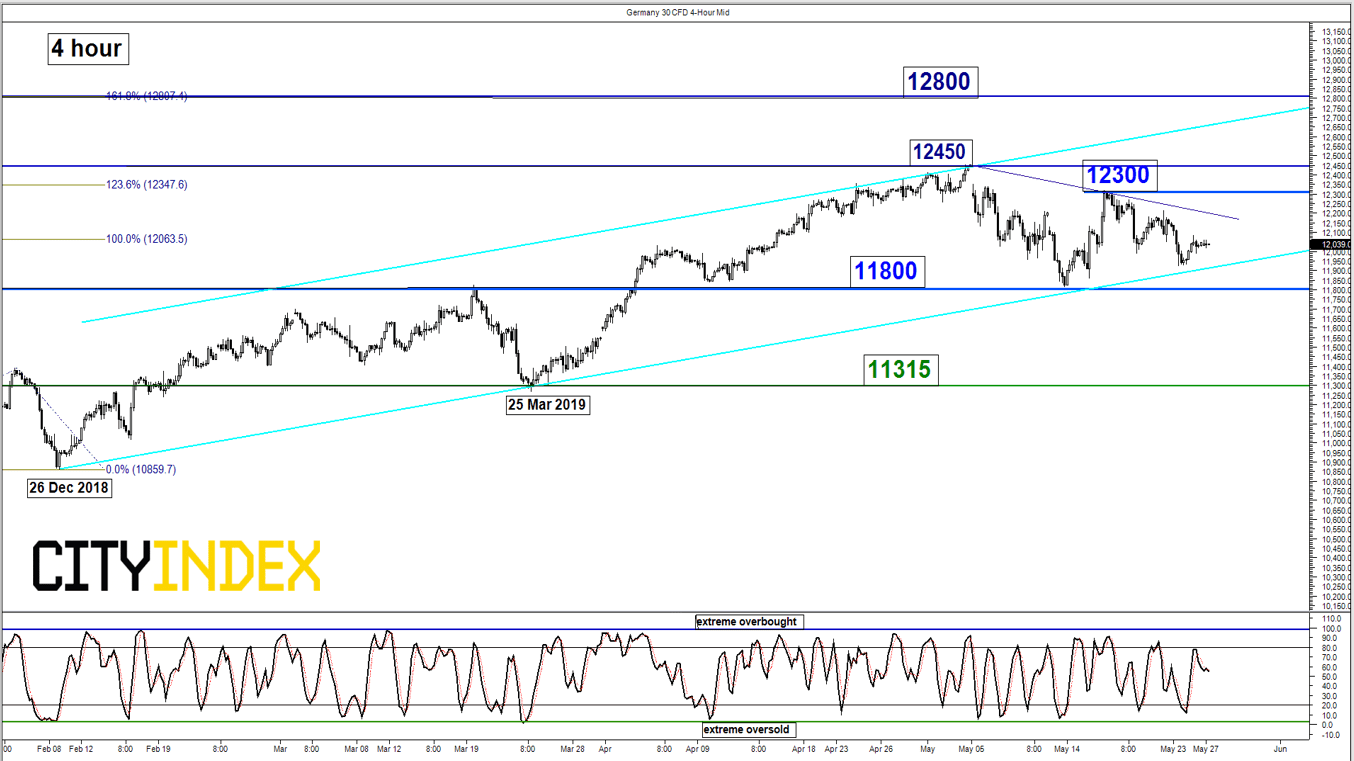
DAX – Bears need to break below 11800
click to enlarge charts
Key Levels (1 to 3 weeks)
Supports: 11800 & 11315
Resistances: 12300, 12450 & 12800
Medium-term (1 to 3 weeks) Outlook
The Germany 30 Index (proxy for the DAX futures) had staged the expected push down and hit the first target/support of 11800 (also the lower boundary of a medium-term ascending channel in place since 26 Dec 2018 low).
The Index has started to trade sideways below 12300 for the past 8 days with mix elements. Prefer to turn neutral between 11800 and 12300. A break with a daily close below 11800 opens up scope for a second downleg of the corrective down move sequence to target the next support at 11315 (also the 50% Fibonacci retracement of the entire up move from 26 De 2018 low to 03 May 2019 high).
On the flipside, a clearance above 12300 resumes the medium-term uptrend to retest 03 May 2019 high of 12450 before a further potential rally towards the next resistance at 12800 (swing high of 27/31 Jul 2018 & Fibonacci expansion/retracement cluster).
Charts are from City Index Advantage TraderPro & eSignal
This report is intended for general circulation only. It should not be construed as a recommendation, or an offer (or solicitation of an offer) to buy or sell any financial products. The information provided does not take into account your specific investment objectives, financial situation or particular needs. Before you act on any recommendation that may be contained in this report, independent advice ought to be sought from a financial adviser regarding the suitability of the investment product, taking into account your specific investment objectives, financial situation or particular needs.
StoneX Financial Pte. Ltd., may distribute reports produced by its respective foreign entities or affiliates within the StoneX group of companies or third parties pursuant to an arrangement under Regulation 32C of the Financial Advisers Regulations. Where the report is distributed to a person in Singapore who is not an accredited investor, expert investor or an institutional investor (as defined in the Securities Futures Act), StoneX Financial Pte. Ltd. accepts legal responsibility to such persons for the contents of the report only to the extent required by law. Singapore recipients should contact StoneX Financial Pte. Ltd. at 6826 9988 for matters arising from, or in connection with the report.
In the case of all other recipients of this report, to the extent permitted by applicable laws and regulations neither StoneX Financial Pte. Ltd. nor its associated companies will be responsible or liable for any loss or damage incurred arising out of, or in connection with, any use of the information contained in this report and all such liability is hereby expressly disclaimed. No representation or warranty is made, express or implied, that the content of this report is complete or accurate.
StoneX Financial Pte. Ltd. is not under any obligation to update this report.
Trading CFDs and FX on margin carries a high level of risk that may not be suitable for some investors. Consider your investment objectives, level of experience, financial resources, risk appetite and other relevant circumstances carefully. The possibility exists that you could lose some or all of your investments, including your initial deposits. If in doubt, please seek independent expert advice. Visit www.cityindex.com/en-sg/terms-and-policies for the complete Risk Disclosure Statement.
ALL TRADING INVOLVES RISKS. LOSSES CAN EXCEED DEPOSITS.
City Index is a trading name of StoneX Financial Pte. Ltd. (“SFP”) for the offering of dealing services in Contracts for Differences (“CFD”). SFP holds a Capital Markets Services Licence issued by the Monetary Authority of Singapore for Dealing in Exchange-Traded Derivatives Contracts, Over-the-Counter Derivatives Contracts, and Spot Foreign Exchange Contracts for the Purposes of Leveraged Foreign Exchange Trading. SFP is also both Derivatives Trading and Clearing member of the Singapore Exchange (“SGX”). SFP is a wholly-owned subsidiary of StoneX Group Inc.
The information provided herein is intended for general circulation. It does not take into account the specific investment objectives, financial situation or particular needs of any particular person. You should take into account your specific investment objectives, financial situation or particular needs before making a commitment to invest, including seeking advice from an independent financial adviser regarding the suitability of the investment, under a separate engagement, as you deem fit. No representation or warranty is given as to the accuracy or completeness of this information. Consequently, any person acting on it does so entirely at their own risk.
The information does not represent an offer of, or solicitation for, a transaction in any investment product. Any views and opinions expressed may be changed without an update. To understand the risks and costs involved, please visit the section captioned “Important Information” and the “Risk Disclosure Statement”.
The information herein is not directed to, or intended for distribution to or use by, any person or entity who is a citizen or resident of or located in any locality, state, country or other jurisdiction where such distribution, publication, availability or use would be contrary to law or regulation.
StoneX Financial Pte. Ltd. 1 Raffles Place, #18-61, One Raffles Place Tower 2, Singapore 048616. Tel: 6309 1000. Co. Reg. No.: 201130598R.
This advertisement has not been reviewed by the Monetary Authority of Singapore.
© City Index 2024