SP500 Long And Short Of It AZO JPM VRSK COG
- The S&P500 nudged its way up to a fresh all-time high yesterday. Without any obvious signs of a top forming, the bias remains bullish above 3069.90.
- 8 of 12 sectors trade at or just below their 52-week highs (or all-time highs, more to the point).
- Energy is the only sector to decline over the past five sessions and trade lower compare with 52-weeks ago.
- Whilst there are plenty of equities rising within the S&P500, finding the ones which don’t appear overextended to the upside (and therefore require consolidation or a retracement) has proven tricky. But on the plus side, we have a large list of bullish equities that will hopefully provide opportunities further out.
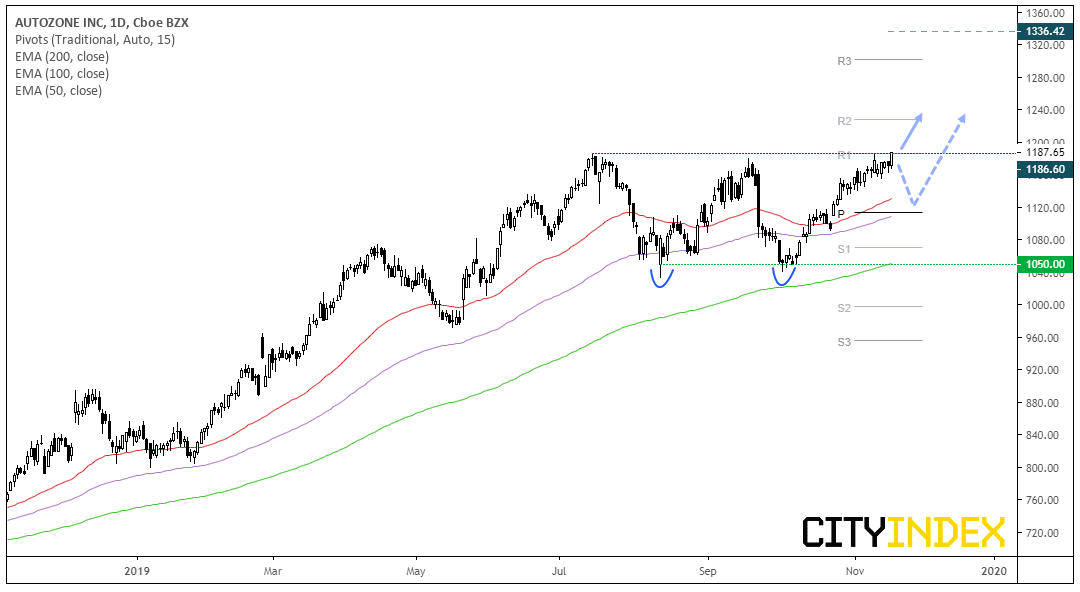
Autozone CFD/DFT (AZO): The automotive parts retailer closed at record highs yesterday, although only just. Still, the equity remains in a clear uptrend and has formed a potential double bottom (which can be a continuation pattern in an uptrend), so we’re looking for this to break higher. Keep in mind that prices have struggled to push higher around current levels twice previously, so bullish momentum need to hold up if the double bottom is to be believed. If prices turn lower, we can reassess – although the trend remains bullish whilst prices hold above the 1040 lows.
- Bias is for the bullish breakout to continue in line with its trend.
- If successful, the double bottom pattern projects and approximate target around 1336.
- Given its at record highs an open upside target can be used. Or bulls can refer to the monthly pivot levels (R2 is currently around 1228 and R3 around 1300 – these levels will obviously change on December 1st).
- However, if bearish momentum takes it back beneath the breakout level it may provide a near-term counter-trend opportunity. Prices have failed to push higher twice near these levels, so it’s certainly a scenario to look out for.
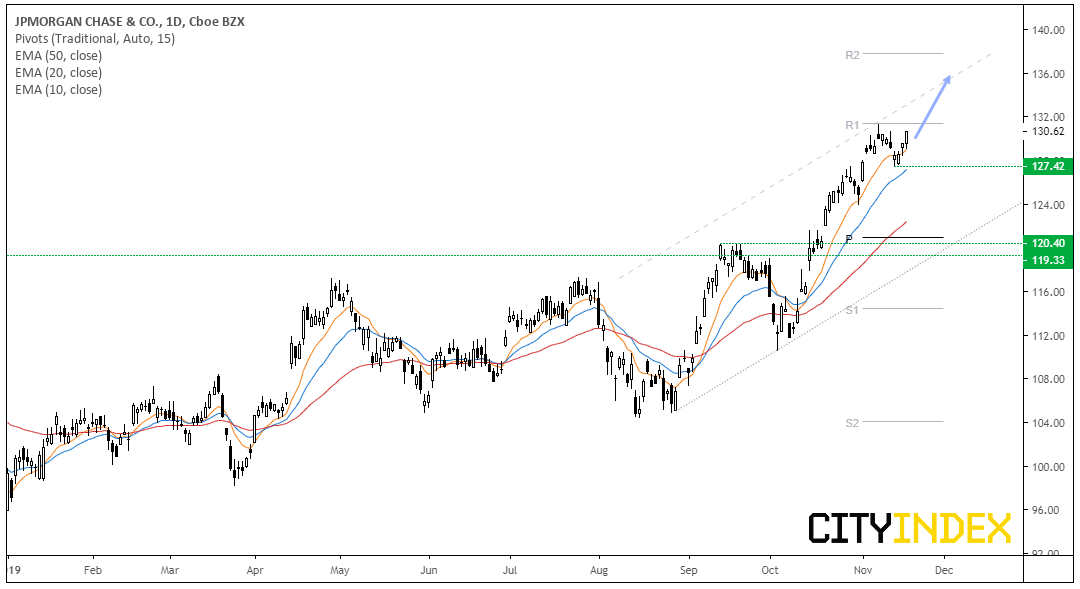
J.P. Morgan Chase CFD/DFT (JPM): Around mid-October, JPM finally broke out of a 20-month consolidation pattern and now sits just off its record high. A decent trend is taking shape and prices are accelerating away from the trendline, which leaves potential for the upper channel to be broken. Moreover, prices are bobbing along the 10-day eMA to show how strong momentum is and a swing low has formed at 127.42.
- Near-term bias remains bullish above 127.42, although a break beneath it merely flags a deeper correction and not a trend reversal.
- A break to record highs could also breach the monthly R2 bring R3 into focus.
- Alternatively, an open upside target could be used with a trailing stop, given prices would be at record highs following a significant breakout of a major, sideways pattern.
Other bullish setups to consider (along the same lines as JPM) are Northern Trust, Valero, LKQ, Hewlett Packard and Paccar Inc.
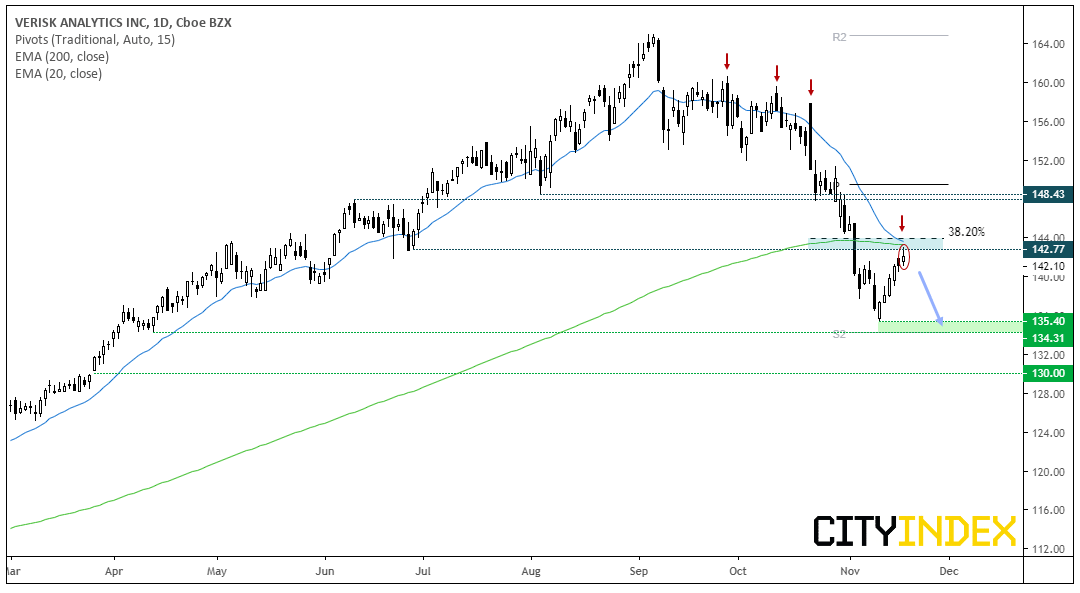
Verisk Analytics CFD/DFT (VRSK): Prices hit a record high in early October before shedding over -17.9% over the next few weeks, taking it on the cusp of a technical bear market. Prices have retreated into a zone of resistance around 144, which comprises of the 20 and 200-day eMAs, 38.2% Fibonacci level and swing lows.
- Bias remains bearish whilst prices trade beneath the resistance cluster
- A bearish hammer has formed at the highs to warn of a hesitancy to push higher, although bears may want to wait for bearish momentum to returns and / or see if prices print a more compelling top (such as a series of doji’s or a 2-bar reversal pattern).
- Initial target is around 134.30/40 where the monthly S2 and structural low reside.
- A break beneath 134 bring 130 into focus, which is a psychological round number and where an upside gap appeared in March.
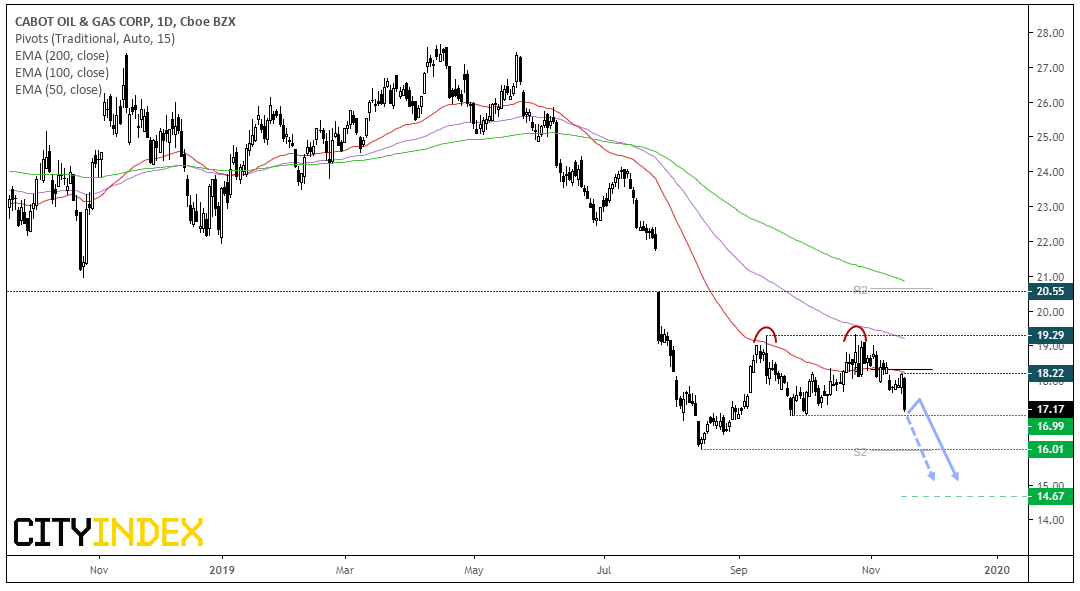
Cabot Oil & Gas Corp CFD/DFT (COG): The independent oil and gas company suffered its most bearish close in nearly 4-months yesterday. That it occurred in line with the dominant, bearish trend suggests it could be headed to new lows. Still, its not uncommon to see a stock rebound the day after a heavy loss, so it’s simply a case of waiting for key support to be broken – whether it be today or thereafter.
- Bias remains bearish whilst prices hold beneath 18.30 (where the 50day eMA, monthly pivot and swing high reside).
- A break beneath 16.99 brings the lows around 16 into focus. However, a double top formed around 19.30 which, if successful, projects an initial target around 14.67
Related analysis:
S&P500: Long Buybacks And Value?
FTSE: The Long & Short Of It | NXT, UTG, EMG, VSVS
ASX200: The Long And Short Of It | XJO, NAN, NCM, BOQ, GNC
S&P500: The Long & Short Of It | SPX, SYS, ORLY, EBAY, TXN
This report is intended for general circulation only. It should not be construed as a recommendation, or an offer (or solicitation of an offer) to buy or sell any financial products. The information provided does not take into account your specific investment objectives, financial situation or particular needs. Before you act on any recommendation that may be contained in this report, independent advice ought to be sought from a financial adviser regarding the suitability of the investment product, taking into account your specific investment objectives, financial situation or particular needs.
StoneX Financial Pte. Ltd., may distribute reports produced by its respective foreign entities or affiliates within the StoneX group of companies or third parties pursuant to an arrangement under Regulation 32C of the Financial Advisers Regulations. Where the report is distributed to a person in Singapore who is not an accredited investor, expert investor or an institutional investor (as defined in the Securities Futures Act), StoneX Financial Pte. Ltd. accepts legal responsibility to such persons for the contents of the report only to the extent required by law. Singapore recipients should contact StoneX Financial Pte. Ltd. at 6826 9988 for matters arising from, or in connection with the report.
In the case of all other recipients of this report, to the extent permitted by applicable laws and regulations neither StoneX Financial Pte. Ltd. nor its associated companies will be responsible or liable for any loss or damage incurred arising out of, or in connection with, any use of the information contained in this report and all such liability is hereby expressly disclaimed. No representation or warranty is made, express or implied, that the content of this report is complete or accurate.
StoneX Financial Pte. Ltd. is not under any obligation to update this report.
Trading CFDs and FX on margin carries a high level of risk that may not be suitable for some investors. Consider your investment objectives, level of experience, financial resources, risk appetite and other relevant circumstances carefully. The possibility exists that you could lose some or all of your investments, including your initial deposits. If in doubt, please seek independent expert advice. Visit www.cityindex.com/en-sg/terms-and-policies for the complete Risk Disclosure Statement.
ALL TRADING INVOLVES RISKS. LOSSES CAN EXCEED DEPOSITS.
City Index is a trading name of StoneX Financial Pte. Ltd. (“SFP”) for the offering of dealing services in Contracts for Differences (“CFD”). SFP holds a Capital Markets Services Licence issued by the Monetary Authority of Singapore for Dealing in Exchange-Traded Derivatives Contracts, Over-the-Counter Derivatives Contracts, and Spot Foreign Exchange Contracts for the Purposes of Leveraged Foreign Exchange Trading. SFP is also both Derivatives Trading and Clearing member of the Singapore Exchange (“SGX”). SFP is a wholly-owned subsidiary of StoneX Group Inc.
The information provided herein is intended for general circulation. It does not take into account the specific investment objectives, financial situation or particular needs of any particular person. You should take into account your specific investment objectives, financial situation or particular needs before making a commitment to invest, including seeking advice from an independent financial adviser regarding the suitability of the investment, under a separate engagement, as you deem fit. No representation or warranty is given as to the accuracy or completeness of this information. Consequently, any person acting on it does so entirely at their own risk.
The information does not represent an offer of, or solicitation for, a transaction in any investment product. Any views and opinions expressed may be changed without an update. To understand the risks and costs involved, please visit the section captioned “Important Information” and the “Risk Disclosure Statement”.
The information herein is not directed to, or intended for distribution to or use by, any person or entity who is a citizen or resident of or located in any locality, state, country or other jurisdiction where such distribution, publication, availability or use would be contrary to law or regulation.
StoneX Financial Pte. Ltd. 1 Raffles Place, #18-61, One Raffles Place Tower 2, Singapore 048616. Tel: 6309 1000. Co. Reg. No.: 201130598R.
This advertisement has not been reviewed by the Monetary Authority of Singapore.
© City Index 2024