Weekly Technical Outlook on Stock Indices Uptrending within a wall of worry
S&P 500 – Bullish break from range
click to enlarge charts
Key Levels (1 to 3 weeks)
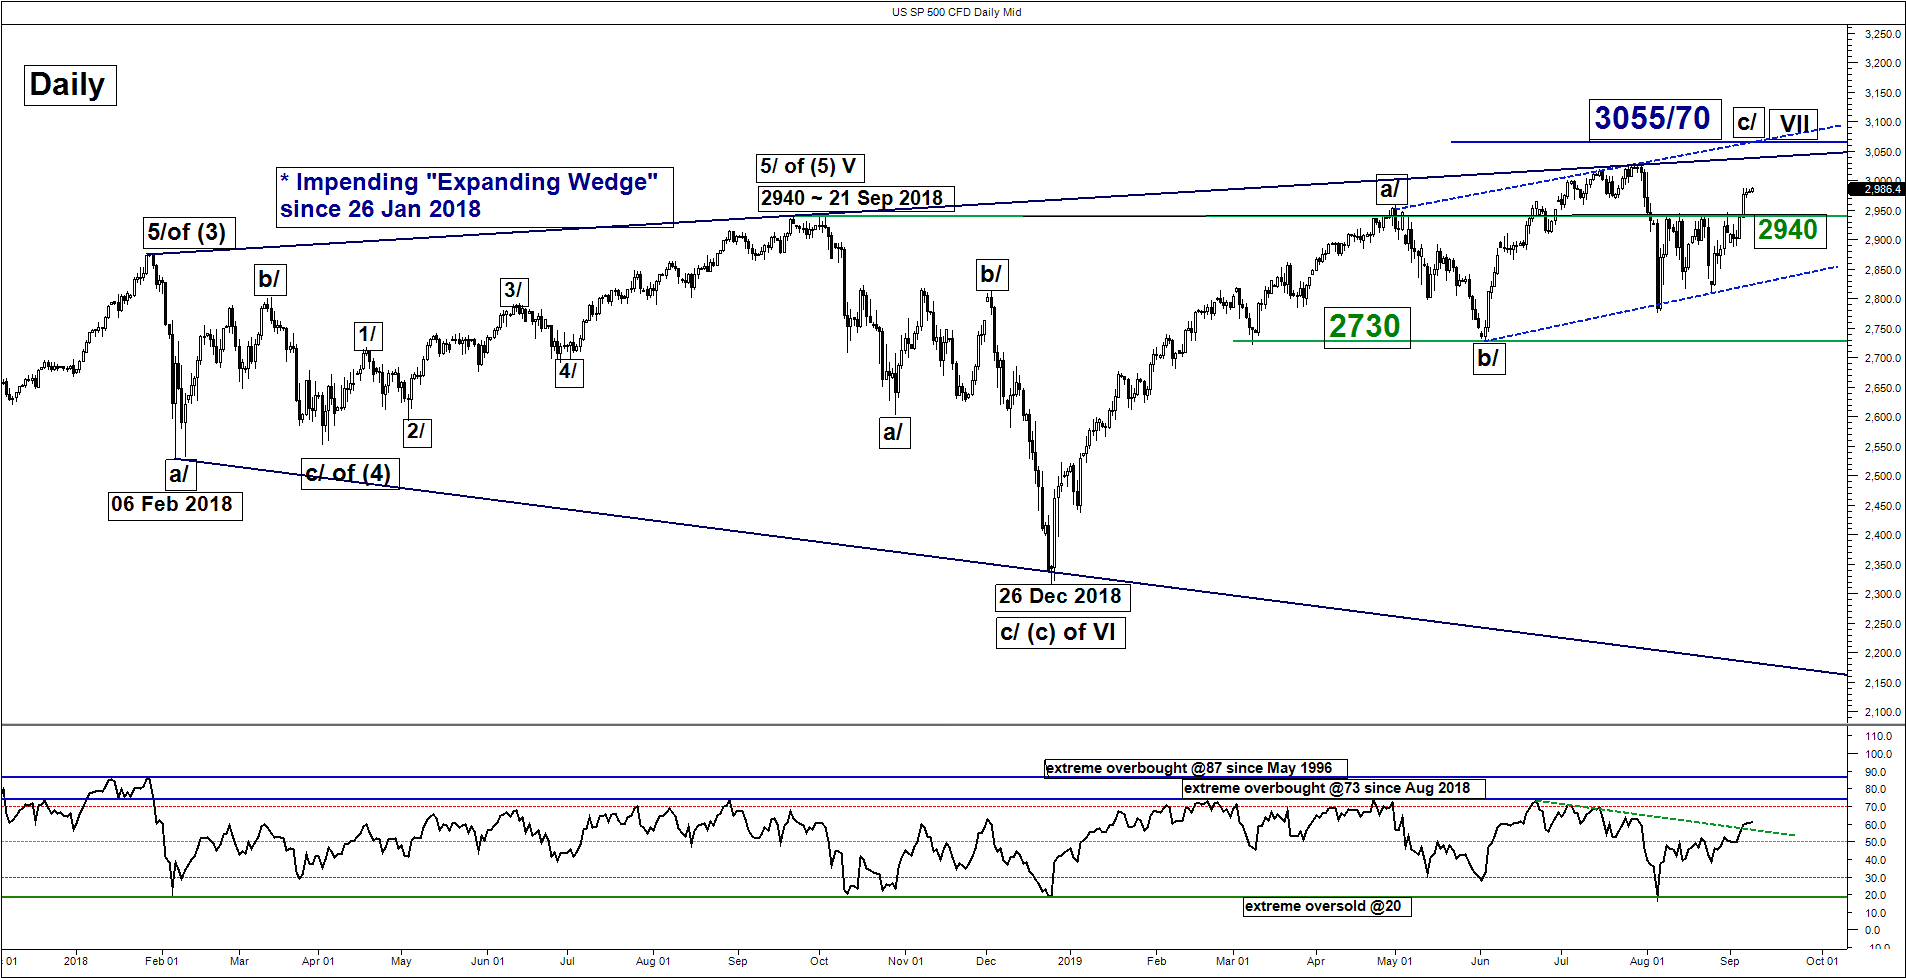
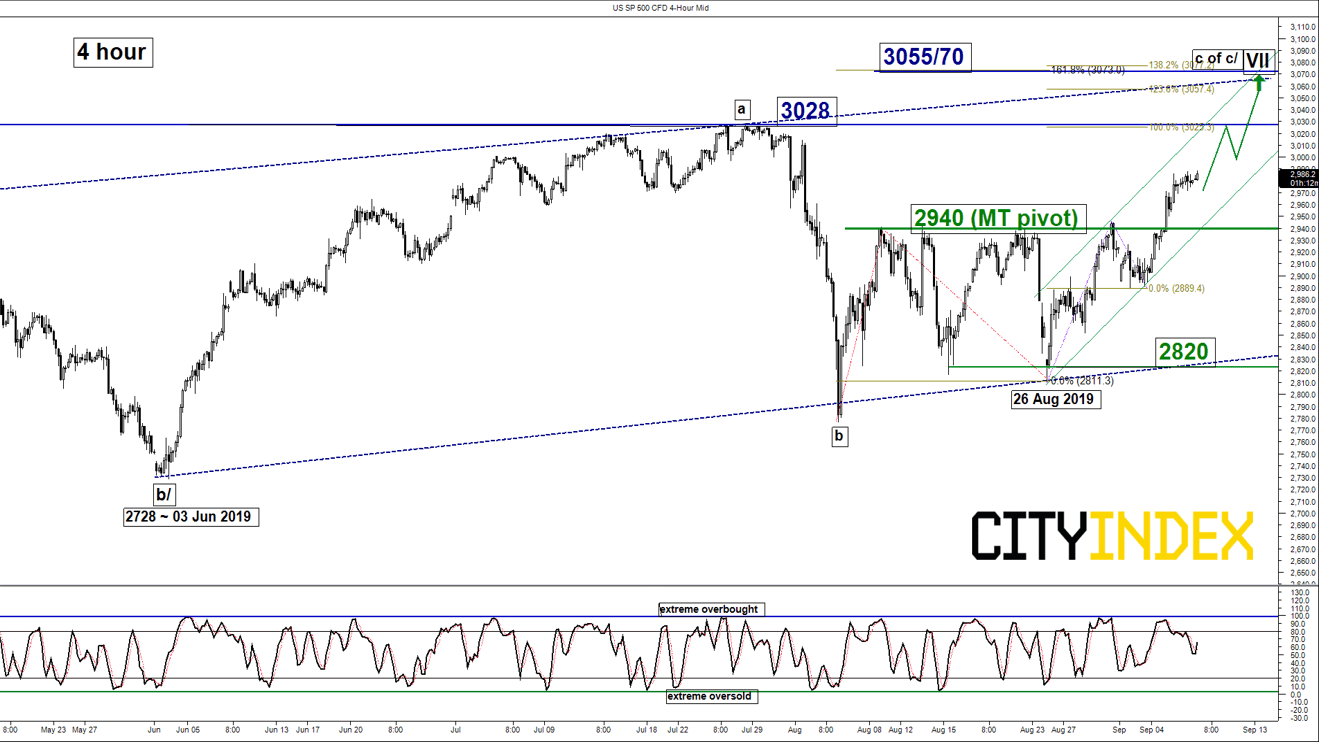
Pivot (key support): 2940
Resistances: 3028 (all-time high) & 3055/70
Next support: 2820
Directional Bias (1 to 3 weeks)
The SP 500 Index (proxy for the S&P 500 futures) has broken above the 2941 upper limit/resistance of a 4-week range configuration in place since 06 Aug 2019 that has invalidated the preferred multi-week bearish bias (click here for a recap).
Flip to a bullish bias in any dips above 2940 key medium-term pivotal support for a further potential push up to retest the current all-time high of 3028 before targeting the next resistance at 3055/70 within a major bearish ‘Expanding Wedge” configuration in place since 26 Jan 2018.
On the other hand, a daily close below 2940 indicates a failure bullish breakout to see another round of choppy decline towards the 2820 support (lower boundary of an ascending range since 03 Jan 2019).
Key elements
- The daily RSI oscillator has broken above a significant corresponding descending resistance that suggests a revival of medium-term upside momentum.
- The next medium-term significant resistance stands at 3055/70 which is defined by the intersection of the (upper boundaries of the “Expanding Wedge” from 26 Jan 2018 & ascending range from 03 Jan 2019), the upper boundary of a minor ascending channel from 26 Aug 2019 and a Fibonacci expansion cluster.
Hang Seng – Breaking above 26700
click to enlarge charts
Key Levels (1 to 3 weeks)
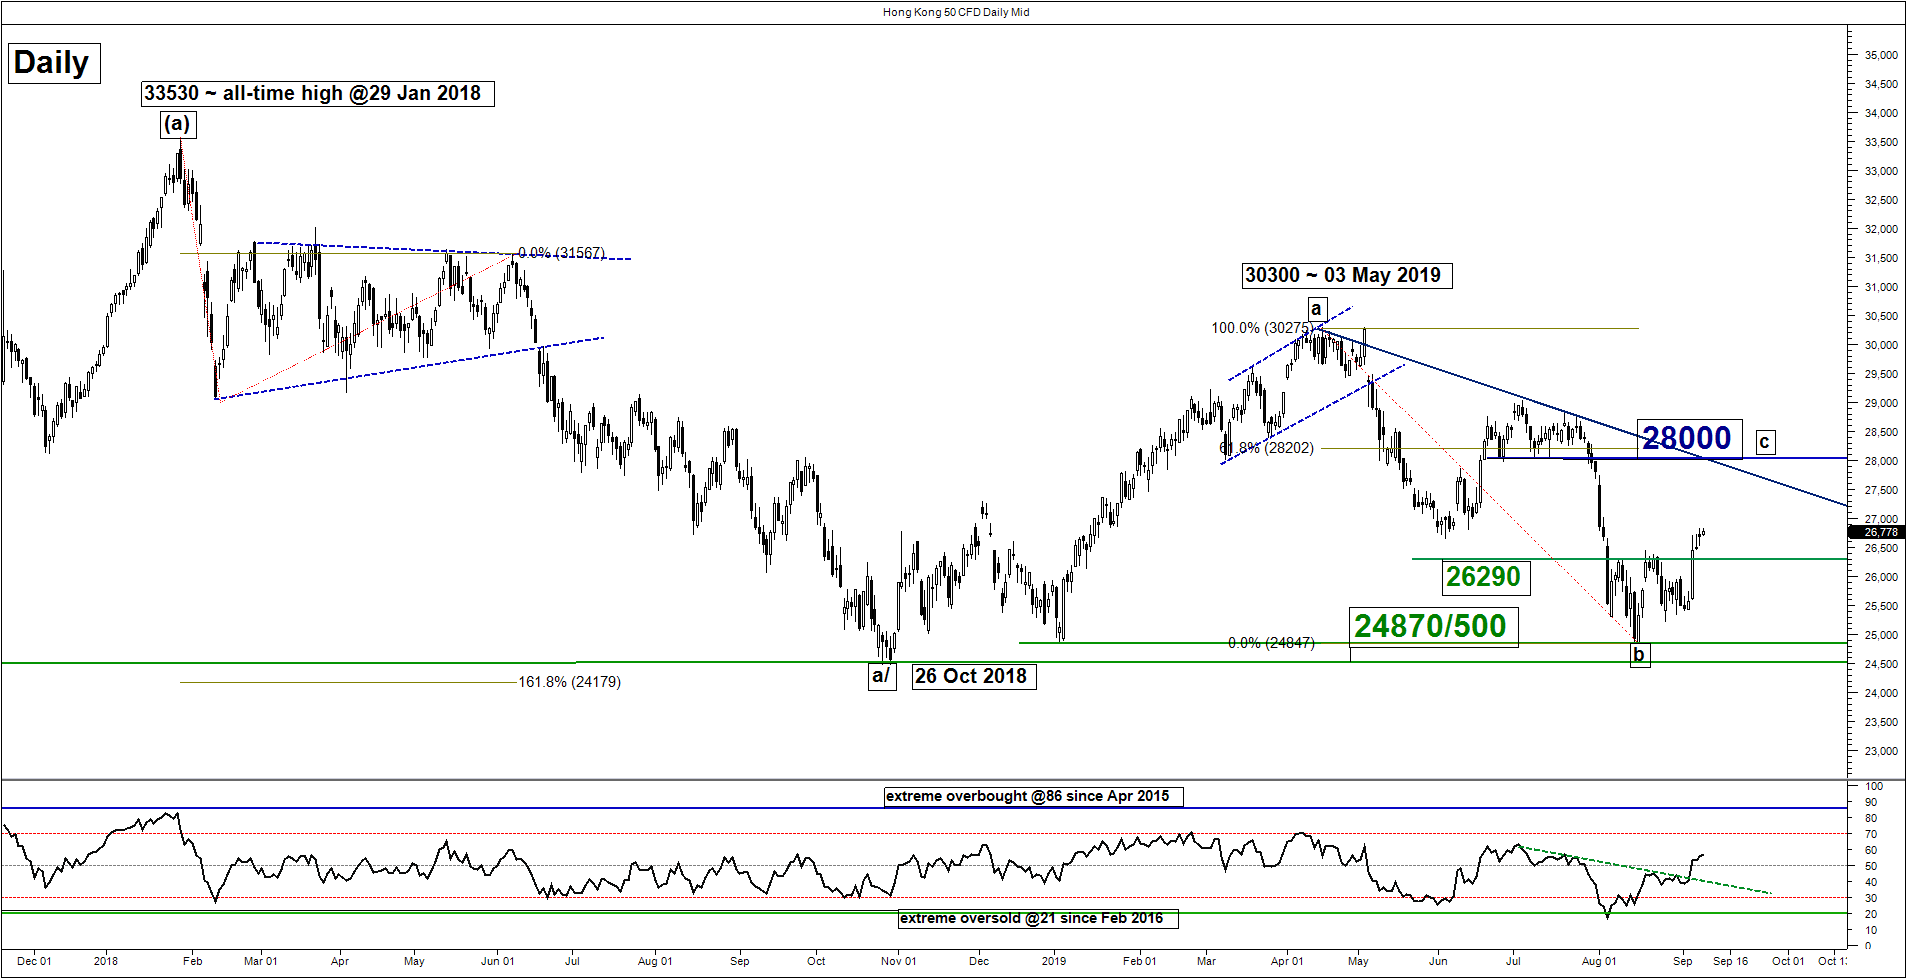
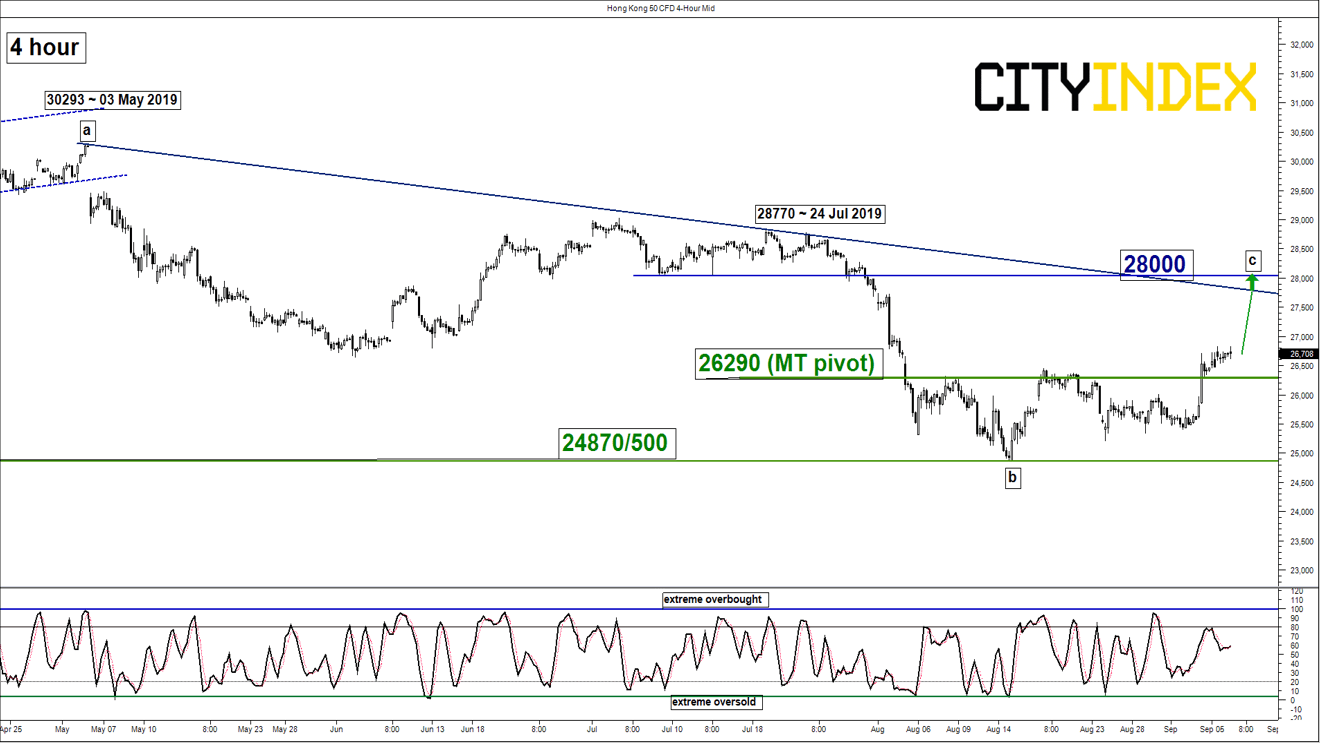
Pivot (key support): 26290
Resistance: 28000
Next support: 24870/500
Directional Bias (1 to 3 weeks)
The Hong Kong 50 Index (proxy for Hang Seng Index futures) has started to stage an attempt to break above 26700 (the former 05 Jun 2019 medium-term swing low) with a positive observation seen in the daily RSI oscillator that has staged a bullish breakout from a corresponding descending resistance.
Flip to a bullish bias in any dips above the 26290 key medium-term pivotal support for a mean reversion rebound to target the next resistance at 28000. On the other hand, a daily close below 26290 revives the bearish tone for a push back down to retest the major range support of 24870/500.
Nikkei 225 – Further up move within an ascending range
click to enlarge charts
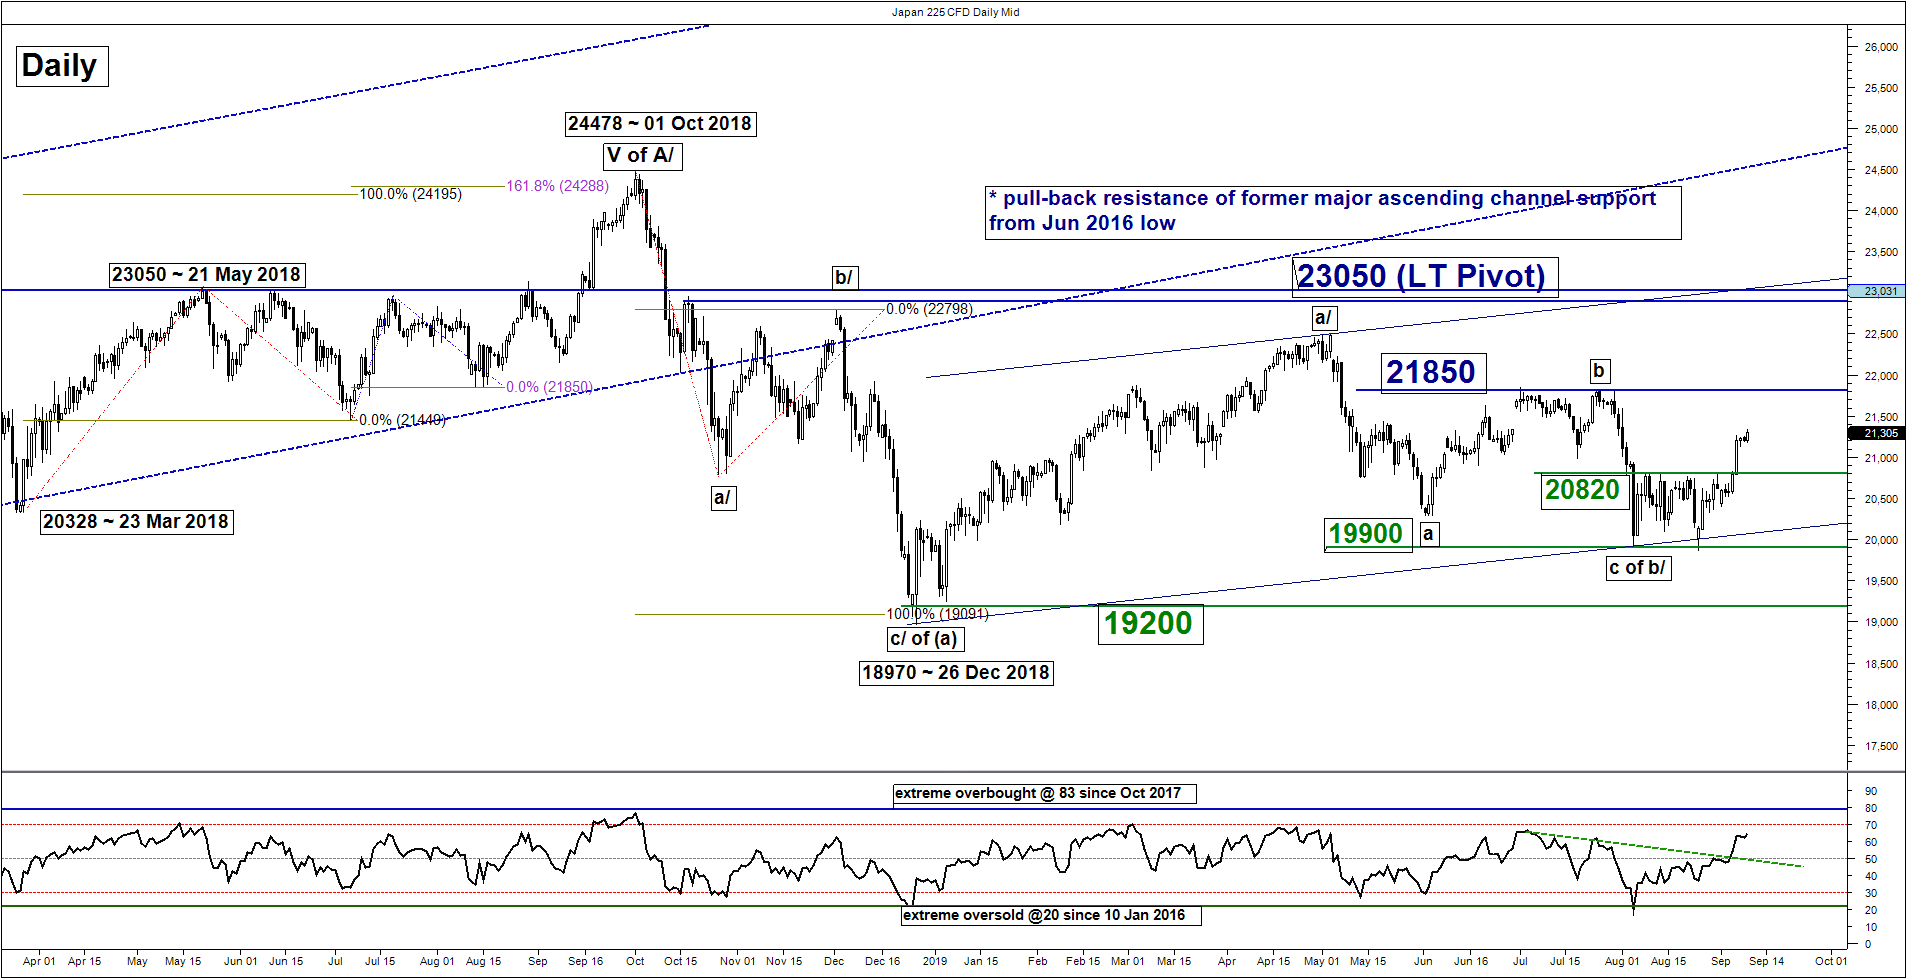
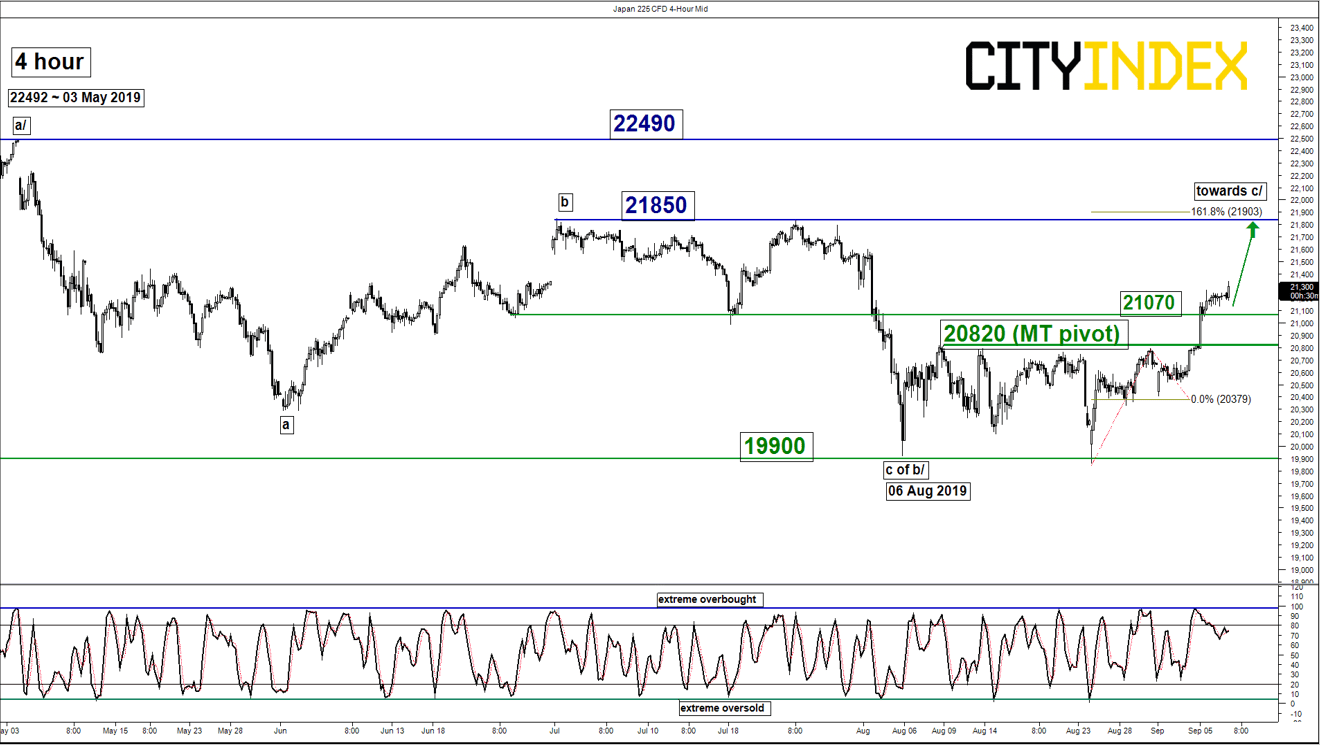
Key Levels (1 to 3 weeks)
Intermediate support: 21070
Pivot (key support): 20820
Resistances: 21850 & 22490
Next support: 19900
Directional Bias (1 to 3 weeks)
The Japan 225 Index (proxy for the Nikkei 225 futures) has staged a bullish break from a 4-week range configuration in place since 06 Aug 2019 that has invalidated the preferred bearish scenario as per highlighted in our previous report.
Flip to a bullish bias in any dips above 20820 key medium-term pivotal support for a further potential push up to target the next resistance at 21850 with a maximum limit set at 22490 (03 May 2019 swing high). On the other hand, a daily close below 20820 suggests a failure bullish breakout for a choppy decline to retest the range support at 19900.
ASX 200 – Further push up above 6530
click to enlarge charts
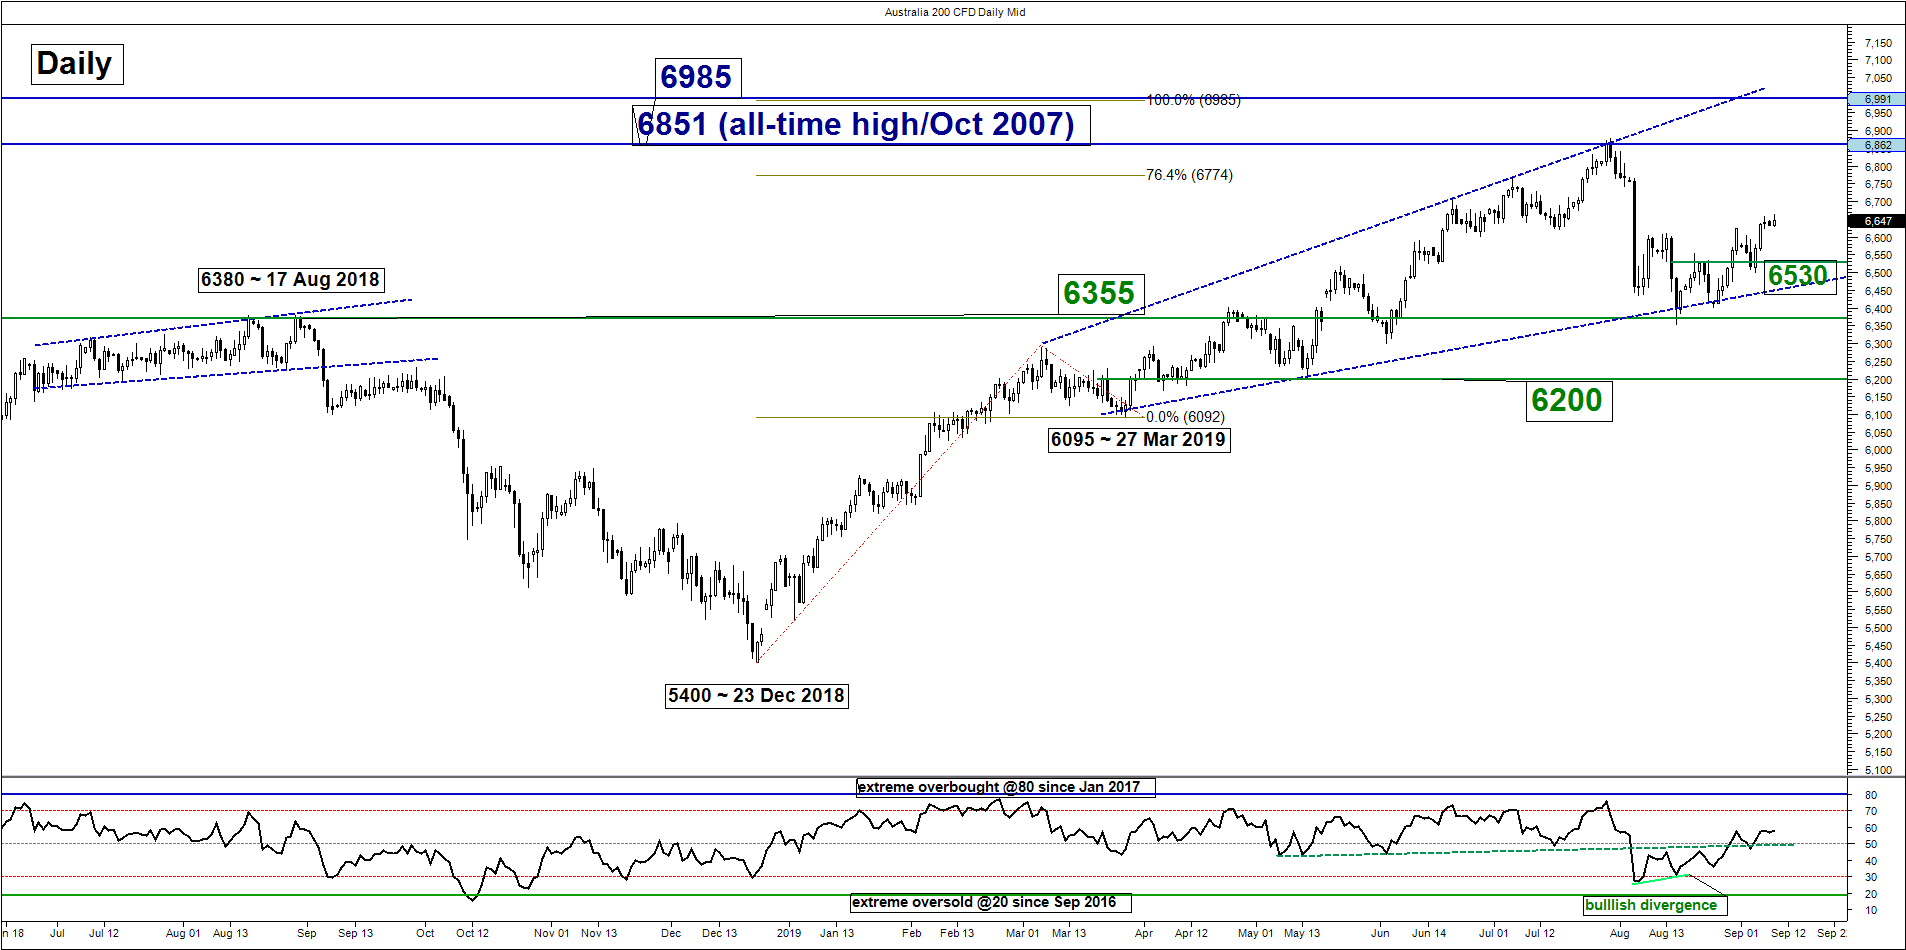
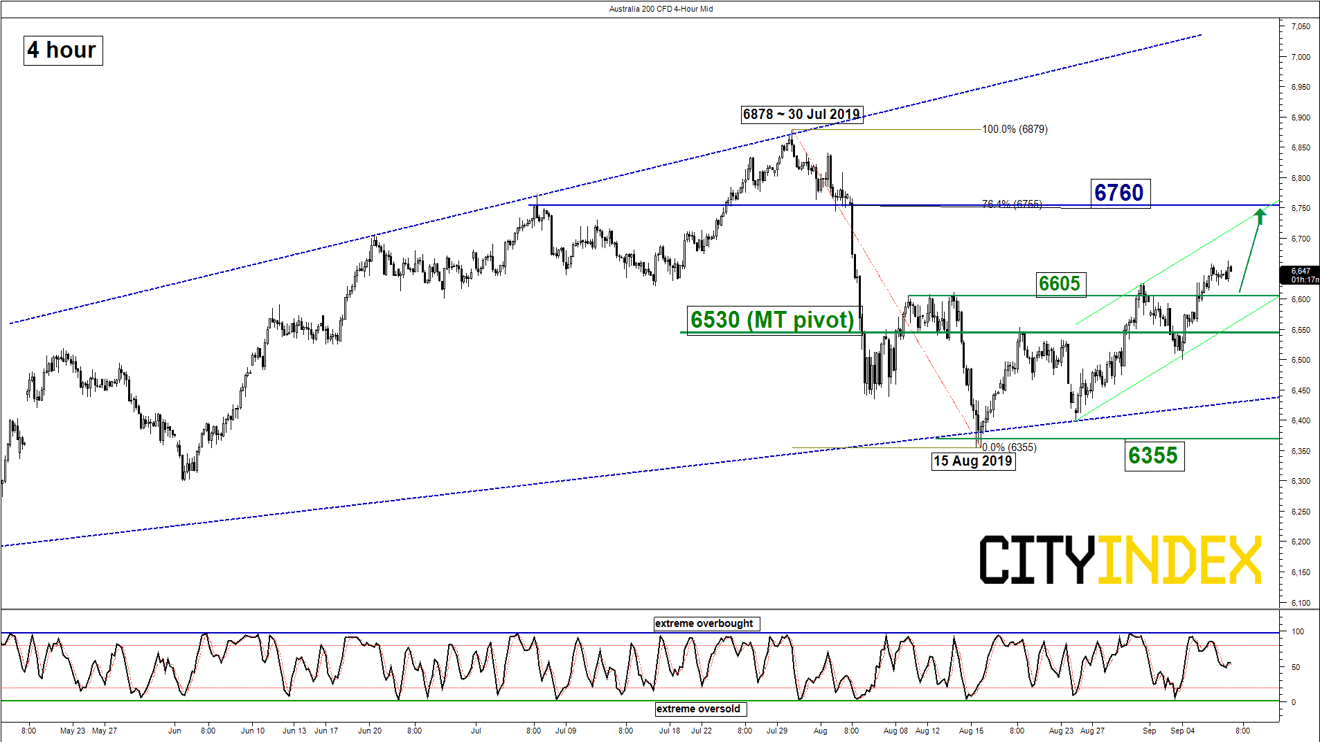
Key Levels (1 to 3 weeks)
Intermediate support: 6605
Pivot (key support): 6530
Resistance: 6760
Next support: 6355
Directional Bias (1 to 3 weeks)
The Australia 200 Index (proxy for the ASX 200 futures) has cleared above the upper limit of the neutrality range at 6530 and validated a further up move.
In addition, the daily RSI oscillator remains positive above the 50 level which indicates a revival of medium-term upside momentum. We turn bullish in any dips above the 6530 key medium-term pivotal support for a further potential push up to target the 6760 resistance in the first step.
On the other hand, a daily close below 6530 negates the bullish tone a slide back to retest 6355 (15 Aug 2019 swing low & close to the lower boundary of an “Expanding Wedge” from 27 Mar 2019 low).
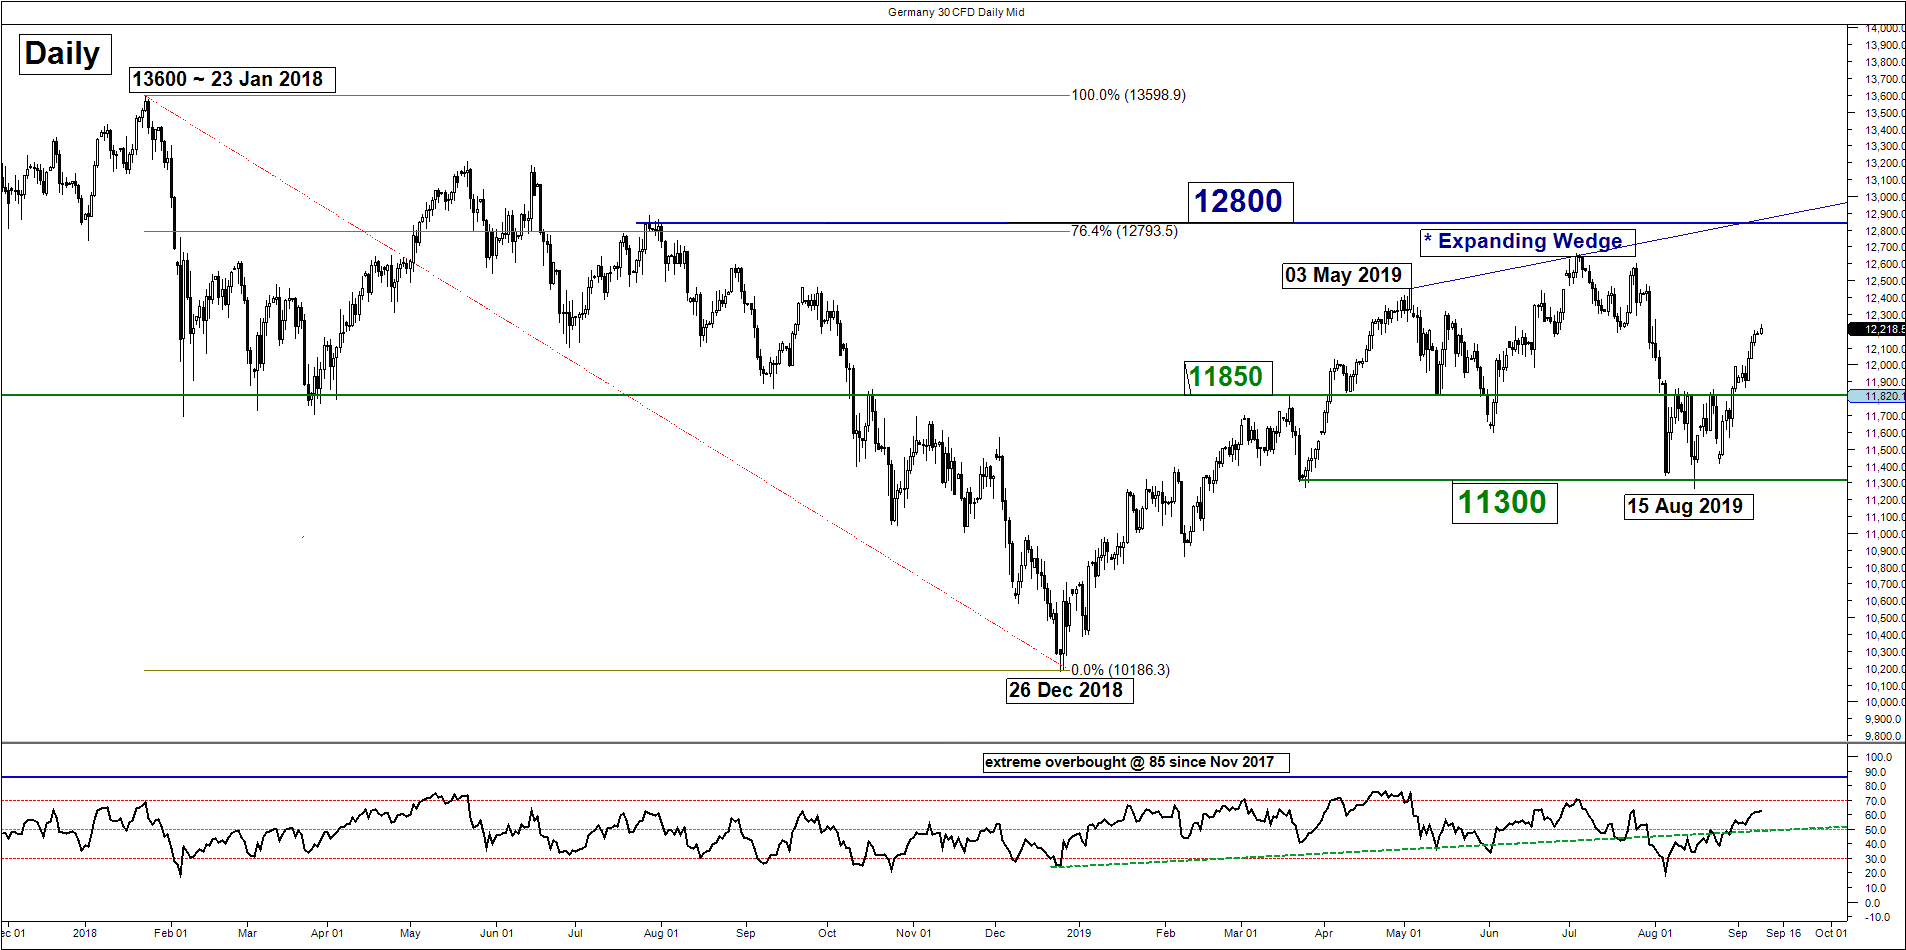
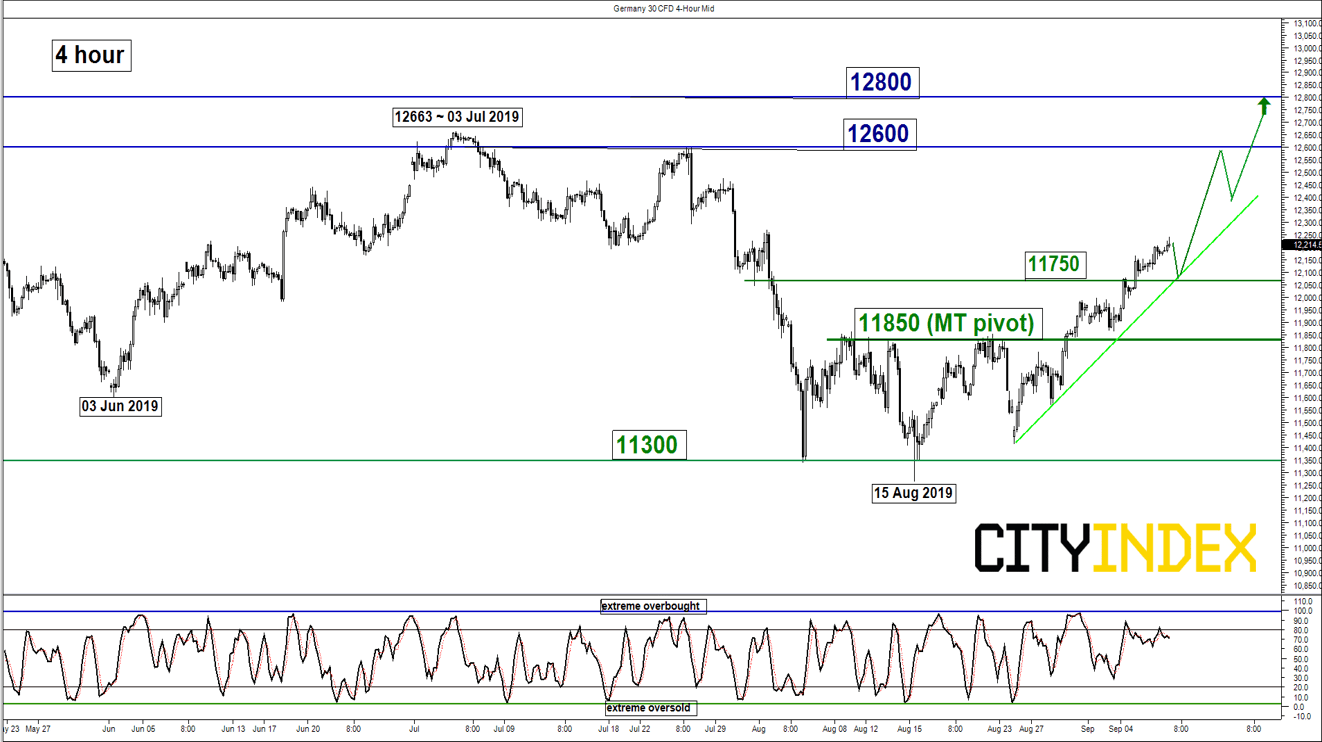
DAX – Further push up above 11850
click to enlarge charts
Key Levels (1 to 3 weeks)
Intermediate support: 11750
Pivot (key support): 11850
Resistances: 12600 & 12800
Next support: 11300
Directional Bias (1 to 3 weeks)
The Germany 30 Index (proxy for the DAX futures) has staged a bullish breakout from a 4-week range configuration in place since 06 Aug 2019. In addition, the daily RSI oscillator has turned bullish above the 50 level which indicates that medium-term upside momentum has resurfaced.
We turn bullish in any dips above the 11850 key medium-term pivotal resistance for a further potential push up to target 12600 follow by 12800 next (upper limit of the “Expanding Wedge” & 76.4% Fibonacci retracement of the previous down move from 23 Jan high to 26 Dec 2018 low).
On the other hand, a daily close below 11850 negates the bullish tone for a slide back to retest the 11300 range support.
Charts are from City Index Advantage TraderPro
StoneX Financial Ltd (trading as “City Index”) is an execution-only service provider. This material, whether or not it states any opinions, is for general information purposes only and it does not take into account your personal circumstances or objectives. This material has been prepared using the thoughts and opinions of the author and these may change. However, City Index does not plan to provide further updates to any material once published and it is not under any obligation to keep this material up to date. This material is short term in nature and may only relate to facts and circumstances existing at a specific time or day. Nothing in this material is (or should be considered to be) financial, investment, legal, tax or other advice and no reliance should be placed on it.
No opinion given in this material constitutes a recommendation by City Index or the author that any particular investment, security, transaction or investment strategy is suitable for any specific person. The material has not been prepared in accordance with legal requirements designed to promote the independence of investment research. Although City Index is not specifically prevented from dealing before providing this material, City Index does not seek to take advantage of the material prior to its dissemination. This material is not intended for distribution to, or use by, any person in any country or jurisdiction where such distribution or use would be contrary to local law or regulation.
For further details see our full non-independent research disclaimer and quarterly summary.
CFDs are complex instruments and come with a high risk of losing money rapidly due to leverage. 69% of retail investor accounts lose money when trading CFDs with this provider. You should consider whether you understand how CFDs work and whether you can afford to take the high risk of losing your money. CFD and Forex Trading are leveraged products and your capital is at risk. They may not be suitable for everyone. Please ensure you fully understand the risks involved by reading our full risk warning.
City Index is a trading name of StoneX Financial Ltd. Head and Registered Office: 1st Floor, Moor House, 120 London Wall, London, EC2Y 5ET. StoneX Financial Ltd is a company registered in England and Wales, number: 05616586. Authorised and regulated by the Financial Conduct Authority. FCA Register Number: 446717.
City Index is a trademark of StoneX Financial Ltd.
The information on this website is not targeted at the general public of any particular country. It is not intended for distribution to residents in any country where such distribution or use would contravene any local law or regulatory requirement.
© City Index 2024